Fig. 8
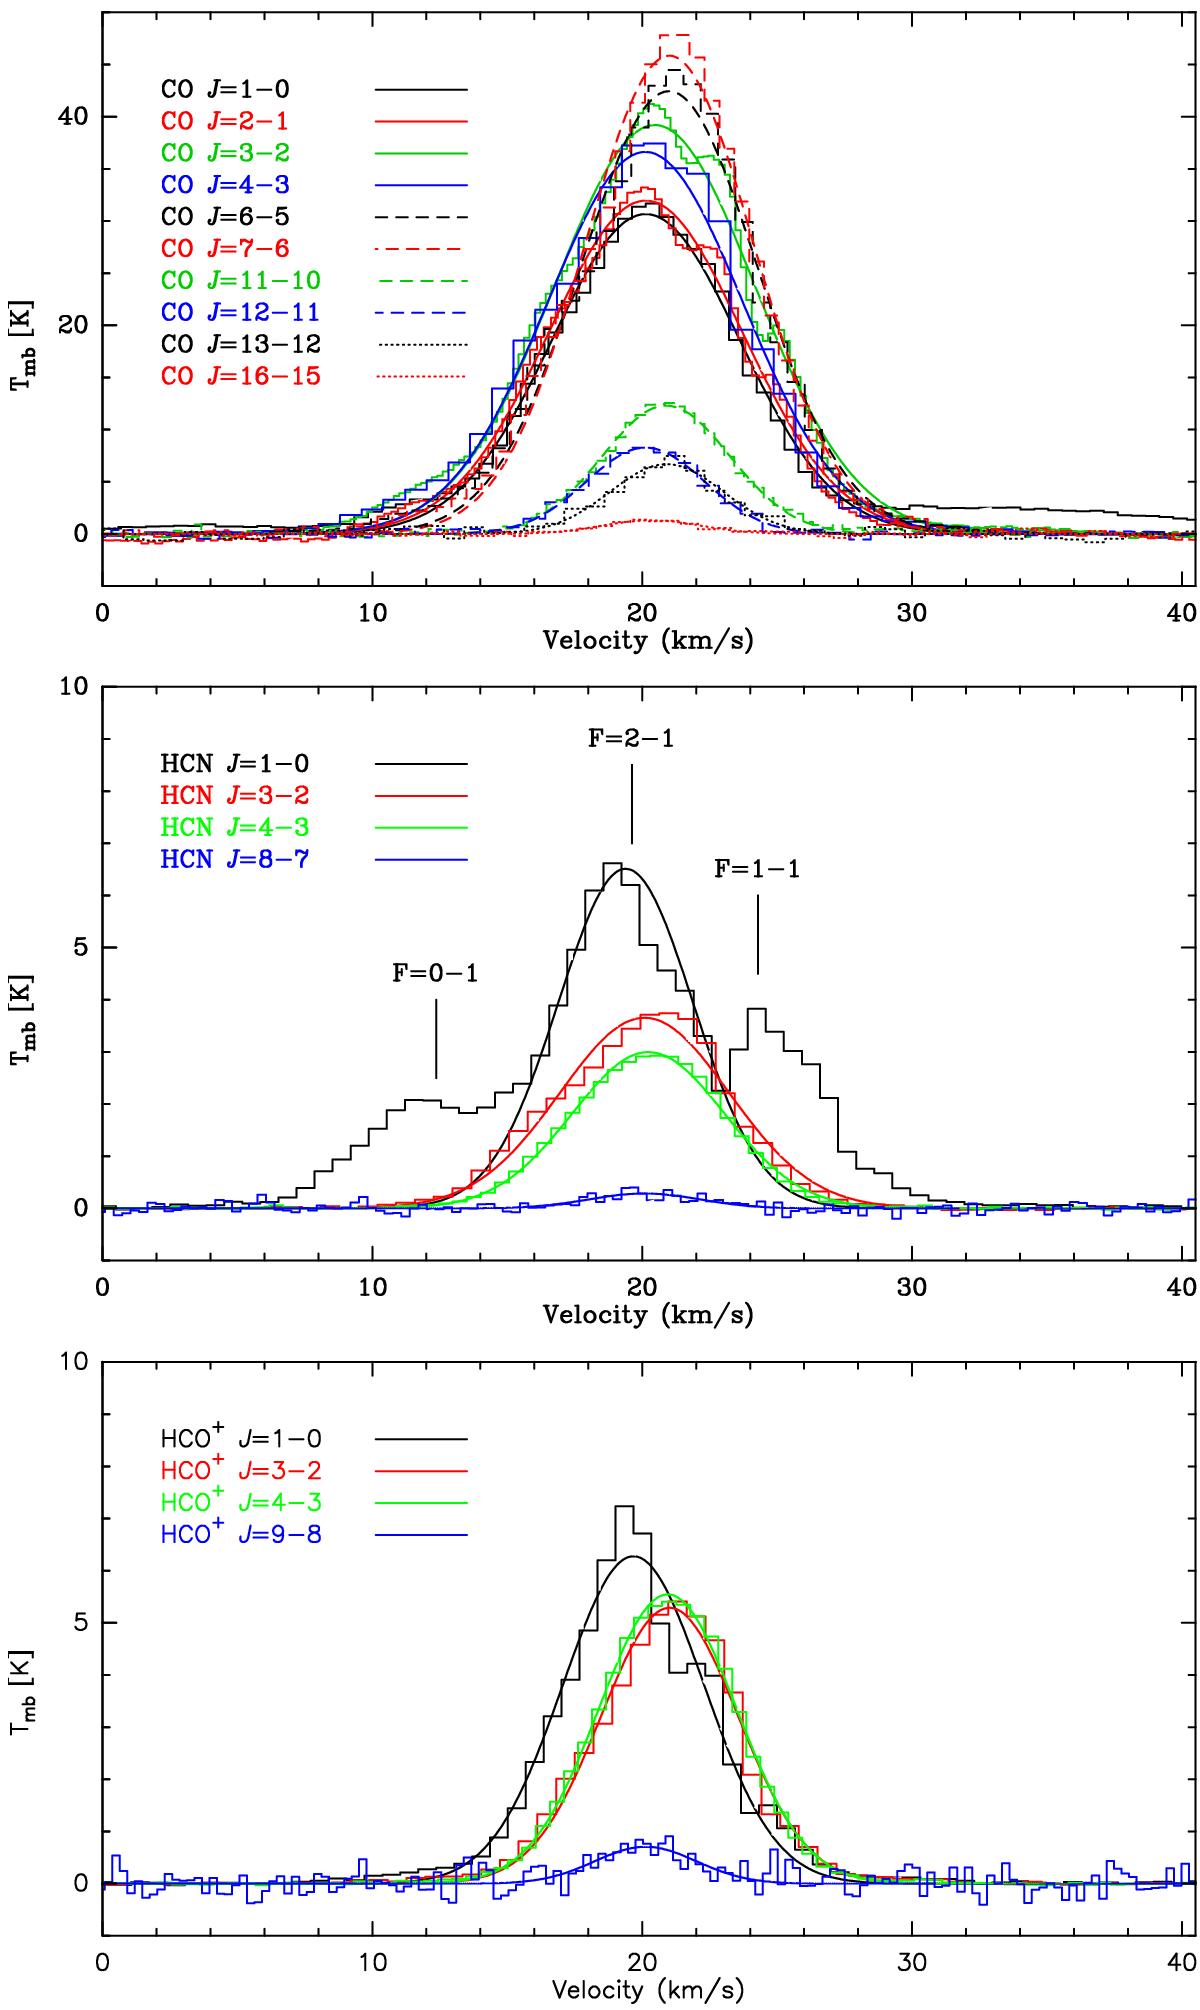
Average spectra of 12CO (top), HCN (middle – indicating the hyperfine structure lines of HCN J = 1 → 0 ) and HCO+ (bottom), obtained from the 200′′-beam area (dashed circle in Fig. 7) toward M17SW, centered at offset position (−100′′, 0′′). This correspond to a region of ~1.92 pc in diameter at the distance of 1.98 kpc (Xu et al. 2011).
Current usage metrics show cumulative count of Article Views (full-text article views including HTML views, PDF and ePub downloads, according to the available data) and Abstracts Views on Vision4Press platform.
Data correspond to usage on the plateform after 2015. The current usage metrics is available 48-96 hours after online publication and is updated daily on week days.
Initial download of the metrics may take a while.