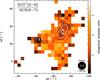
Fig. 6
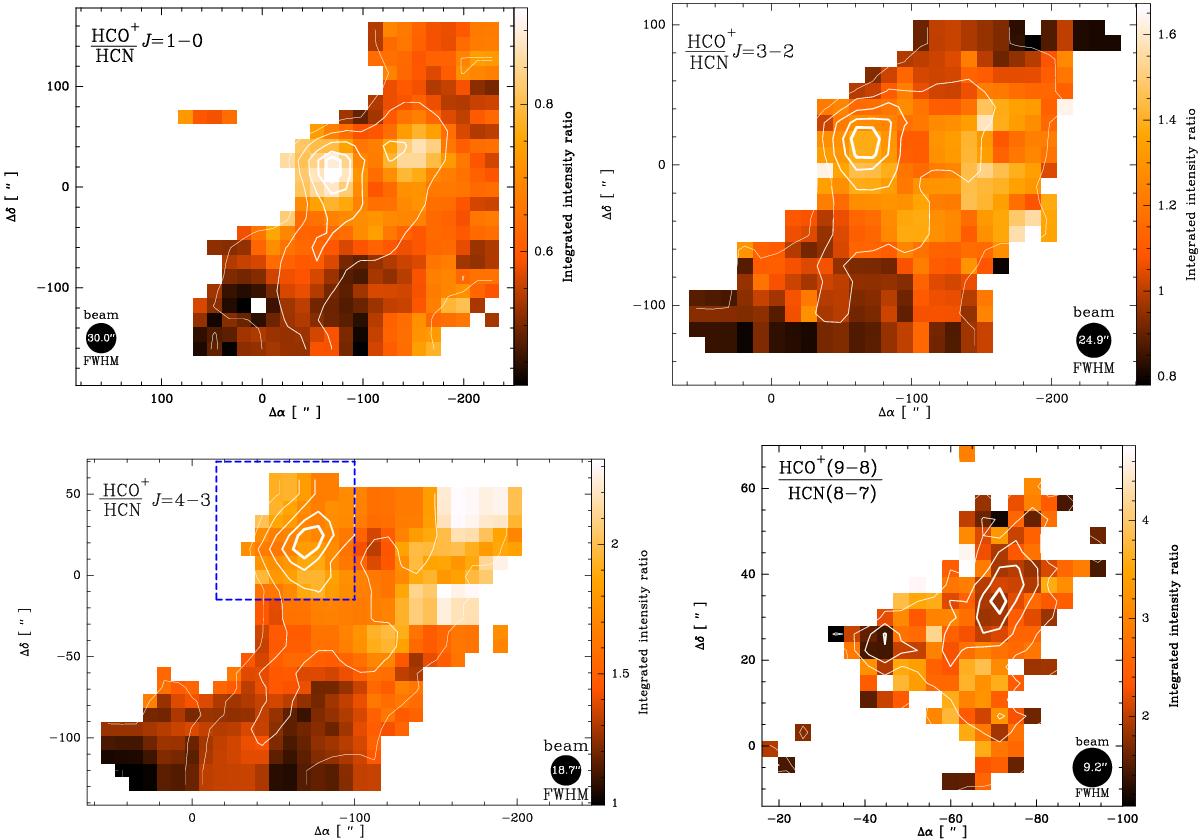
Maps of the HCO+/HCN ratio between the J = 1 → 0 (top left), J = 3 → 2 (top right) and J = 4 → 3 (bottom left) line integrated intensities in the region where the lines are brighter than 7% of their peak values. The J = 1 → 0 ratio varies between about 0.4 and 0.9. The isolated ratios shown at Δδ ~ 70′′ correspond to significant emission of ~30 K km s-1 in both HCN and HCO+J = 1 → 0 lines. The J = 3 → 2 line ratio ranges from ~0.8 to ~1.7 while the J = 4 → 3 line ratio varies between ~1.0 and ~2.3. The contour lines correspond to the HCO+J = 1 → 0, J = 3 → 2, and J = 4 → 3 maps in the respective line ratios, and are defined as in Fig. 2. The HCO+J = 9 → 8 to HCN J = 8 → 7 line ratio is shown in the bottom right panel, for the region where the lines are brighter than 15% of their peak values. This ratio varies between about unity to ~4.8. The contour lines correspond to the HCN J = 8 → 7 maps and are the same as in Fig. 3. The area of the higher-J HCN and HCO+ ratio map is depicted with a dashed frame in the bottom left panel. The maps of the higher frequency lines were convolved to the larger beam of the lower frequency line before determining the respective ratios.
Current usage metrics show cumulative count of Article Views (full-text article views including HTML views, PDF and ePub downloads, according to the available data) and Abstracts Views on Vision4Press platform.
Data correspond to usage on the plateform after 2015. The current usage metrics is available 48-96 hours after online publication and is updated daily on week days.
Initial download of the metrics may take a while.