Fig. 4
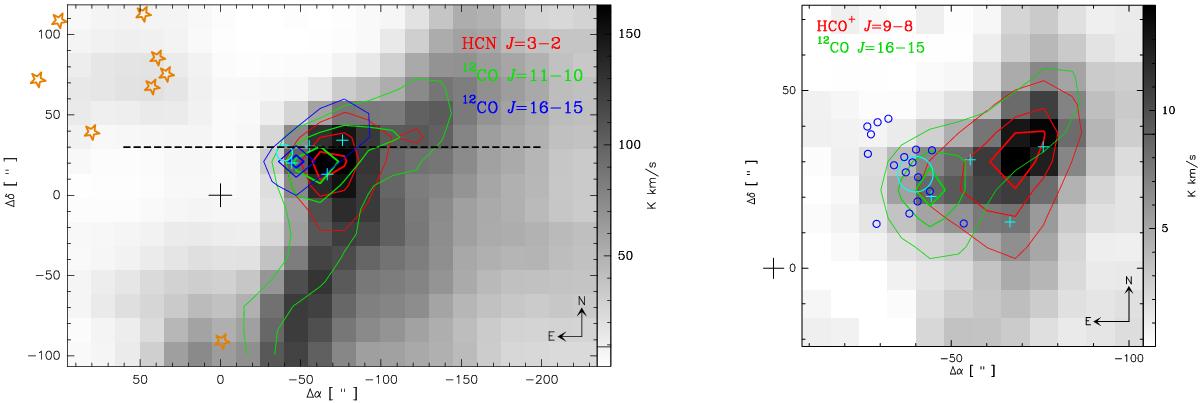
Left panel: velocity-integrated intensity maps of HCN J = 1 → 0 (grey), HCN J = 3 → 2 (red contour), 12CO J = 11 → 10 (green contour), and 12CO J = 16 → 15 (blue contour). The contour levels (from thin to thick) are the 50%, 75%, and 90% of the respective peak emissions. The stars on the top left show the location of O and B ionizing stars (Beetz et al. 1976; Hanson et al. 1997). The reference position (Δα = 0, Δδ = 0) is the same as in Fig. 1. The ultracompact H II region M17-UC1 and four H2O masers (Johnson et al. 1998) are labeled with the (cyan) circle and plus symbols, respectively. The horizontal dashed line depict the strip lines shown in Fig. 5. All maps are convolved to a 30′′ beam to match the resolution of the HCN J = 1 → 0 map. Right panel: velocity-integrated intensity maps of HCN J = 8 → 7 (gray), HCO+J = 9 → 8 (red contour), and 12CO J = 16 → 15 (green contour). The blue circles correspond to the heavily obscured (Emedian> 2.5 keV, AV ≥ 10 mag) population of X-ray sources around the M17-UC1 region (Fig. 10 in Broos et al. 2007; coordinates from the VizieR catalogue). In this case, all maps were convolved to the beam size (![]() ) of the 12CO J = 16 → 15 map.
) of the 12CO J = 16 → 15 map.
Current usage metrics show cumulative count of Article Views (full-text article views including HTML views, PDF and ePub downloads, according to the available data) and Abstracts Views on Vision4Press platform.
Data correspond to usage on the plateform after 2015. The current usage metrics is available 48-96 hours after online publication and is updated daily on week days.
Initial download of the metrics may take a while.