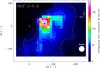
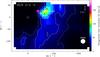
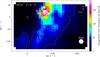
Fig. 2
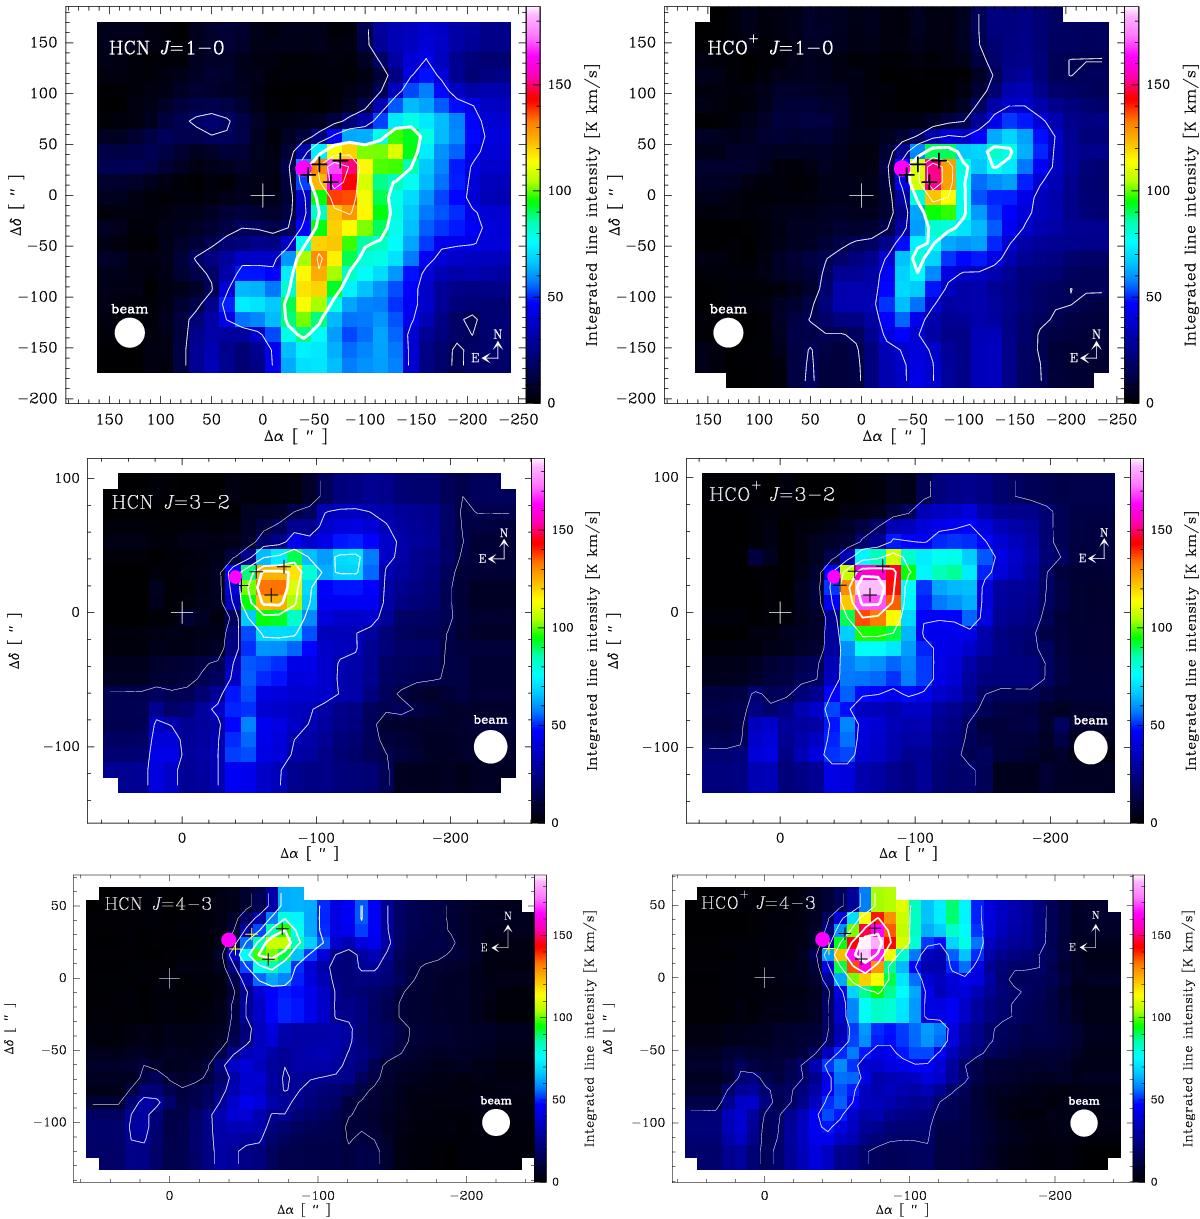
Top panels: maps of the integrated temperature of the HCN and HCO+J = 1 → 0 lines in M17 SW. The peak emissions are ~169 K km s-1 and ~152 K km s-1, respectively. The contour levels for all panels in this figure are, from thin to thick, 10%, 25%, 50%, 75%, and 90% of the peak emission. Middle panels: maps of the integrated temperature of HCN and HCO+J = 3 → 2 lines, with peak emissions of ~133 K km s-1 and ~183 K km s-1, respectively. Bottom panels: maps of the integrated temperature of the HCN and HCO+J = 4 → 3 lines in M17 SW. The peak emissions are ~107 K km s-1 and ~187 K km s-1, respectively. The reference position (Δα = 0, Δδ = 0) is labeled with a cross, and other symbols are indicated as in Fig. 1. The integrated temperature scale is the same in all maps.
Current usage metrics show cumulative count of Article Views (full-text article views including HTML views, PDF and ePub downloads, according to the available data) and Abstracts Views on Vision4Press platform.
Data correspond to usage on the plateform after 2015. The current usage metrics is available 48-96 hours after online publication and is updated daily on week days.
Initial download of the metrics may take a while.