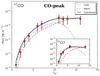
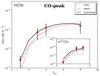
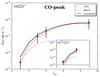
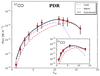
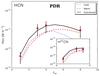
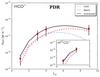
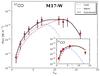
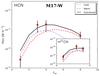
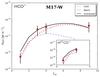
Fig. 13
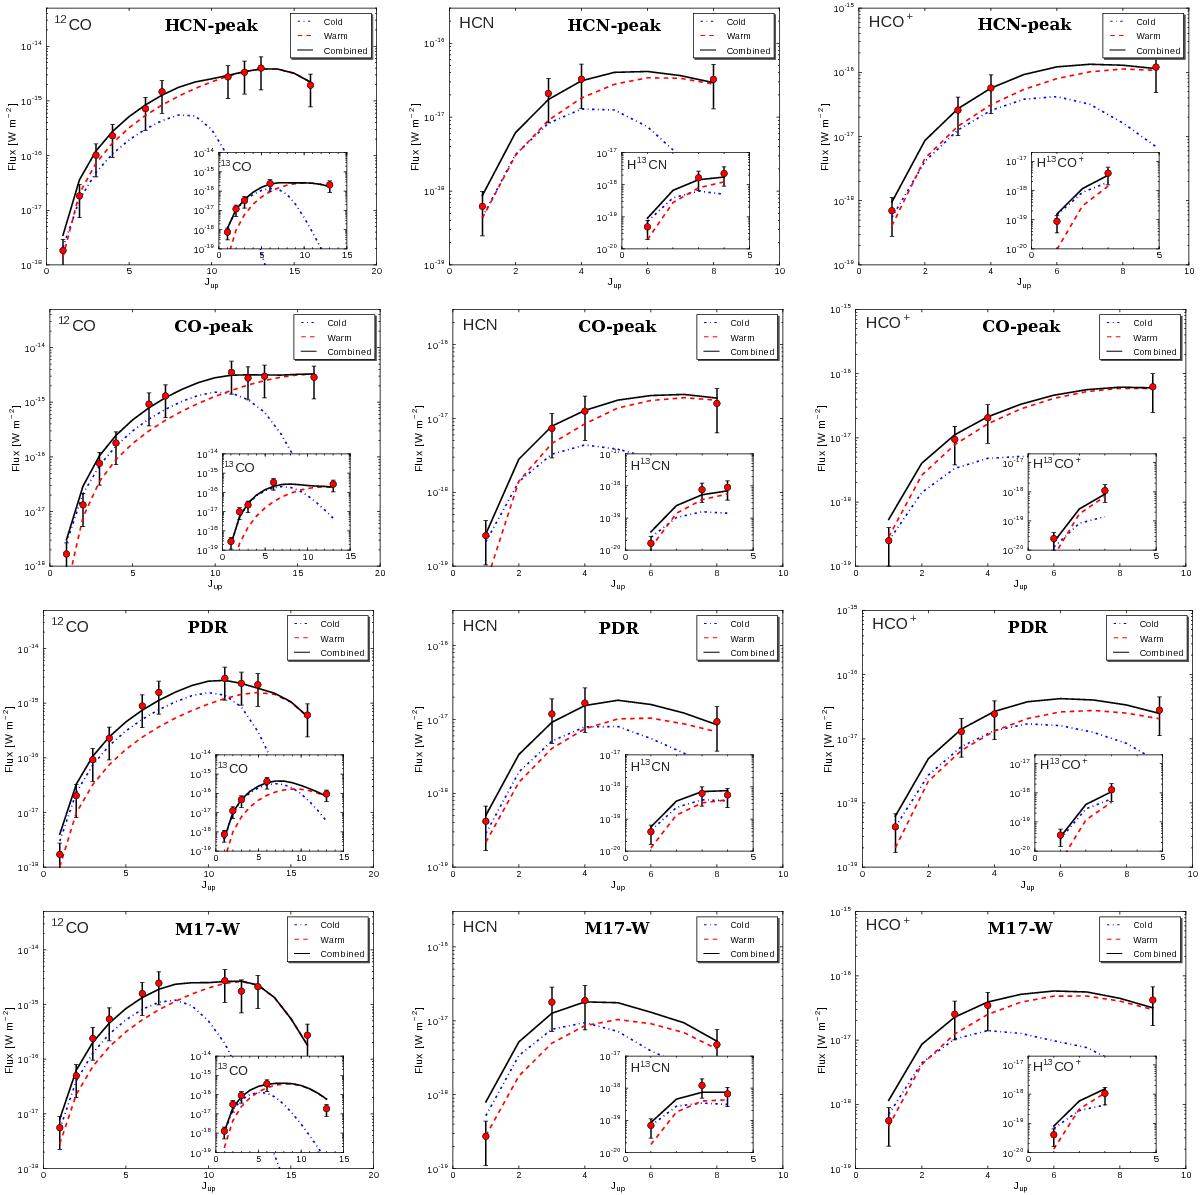
Two-component fit of the line spectral energy distribution of the (from left to right) CO, HCN, and HCO+ species, for the (from top to bottom) spectra at offset position (−65′′, +31′′) toward the peak of the HCN J = 8 → 7 intensity, (−40′′, +18′′) toward the peak of the 12CO J = 16 → 15 intensity, (−60′′, −30′′) toward the PDR, and (−130′′, +30′′) toward the molecular gas in M17 SW. The fit of the 13C bearing isotopologues is shown in the insets. The cold and warm components are shown in dotted and dashed lines, respectively. The error bars are as in Fig. 9.
Current usage metrics show cumulative count of Article Views (full-text article views including HTML views, PDF and ePub downloads, according to the available data) and Abstracts Views on Vision4Press platform.
Data correspond to usage on the plateform after 2015. The current usage metrics is available 48-96 hours after online publication and is updated daily on week days.
Initial download of the metrics may take a while.