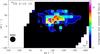
Fig. 1
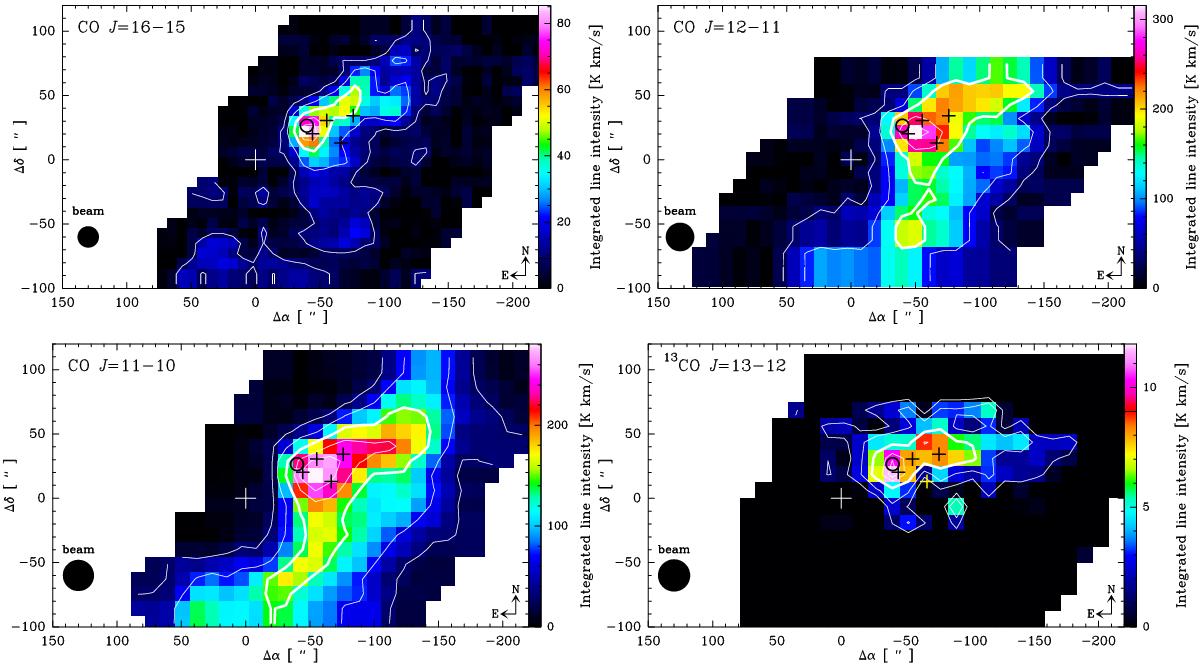
Colour maps of the integrated intensity of the J = 16 → 15, J = 12 → 11 and J = 11 → 10 transitions of 12CO, and the 13CO J = 13 → 12 line in M17 SW. The contour levels are the 10%, 25%, 50% (thick line), 75%, and 90% of the peak emissions. The central position (Δα = 0, Δδ = 0), labeled with a cross, corresponds to the star SAO 161357 at RA(J2000) = 18h20m27.6s and Dec(J2000) = ![]() . The ultracompact H II region M17-UC1 and four H2O masers (Johnson et al. 1998) are indicated with circle and plus symbols, respectively. The 13CO J = 13 → 12 map was convolved with a 25′′ beam to match the resolution of the 12CO J = 12 → 11 and to increase the S/N. All pixels with S/N< 3 (or an rms > 0.22 K) were blanked in the 13CO map.
. The ultracompact H II region M17-UC1 and four H2O masers (Johnson et al. 1998) are indicated with circle and plus symbols, respectively. The 13CO J = 13 → 12 map was convolved with a 25′′ beam to match the resolution of the 12CO J = 12 → 11 and to increase the S/N. All pixels with S/N< 3 (or an rms > 0.22 K) were blanked in the 13CO map.
Current usage metrics show cumulative count of Article Views (full-text article views including HTML views, PDF and ePub downloads, according to the available data) and Abstracts Views on Vision4Press platform.
Data correspond to usage on the plateform after 2015. The current usage metrics is available 48-96 hours after online publication and is updated daily on week days.
Initial download of the metrics may take a while.