Fig. 1
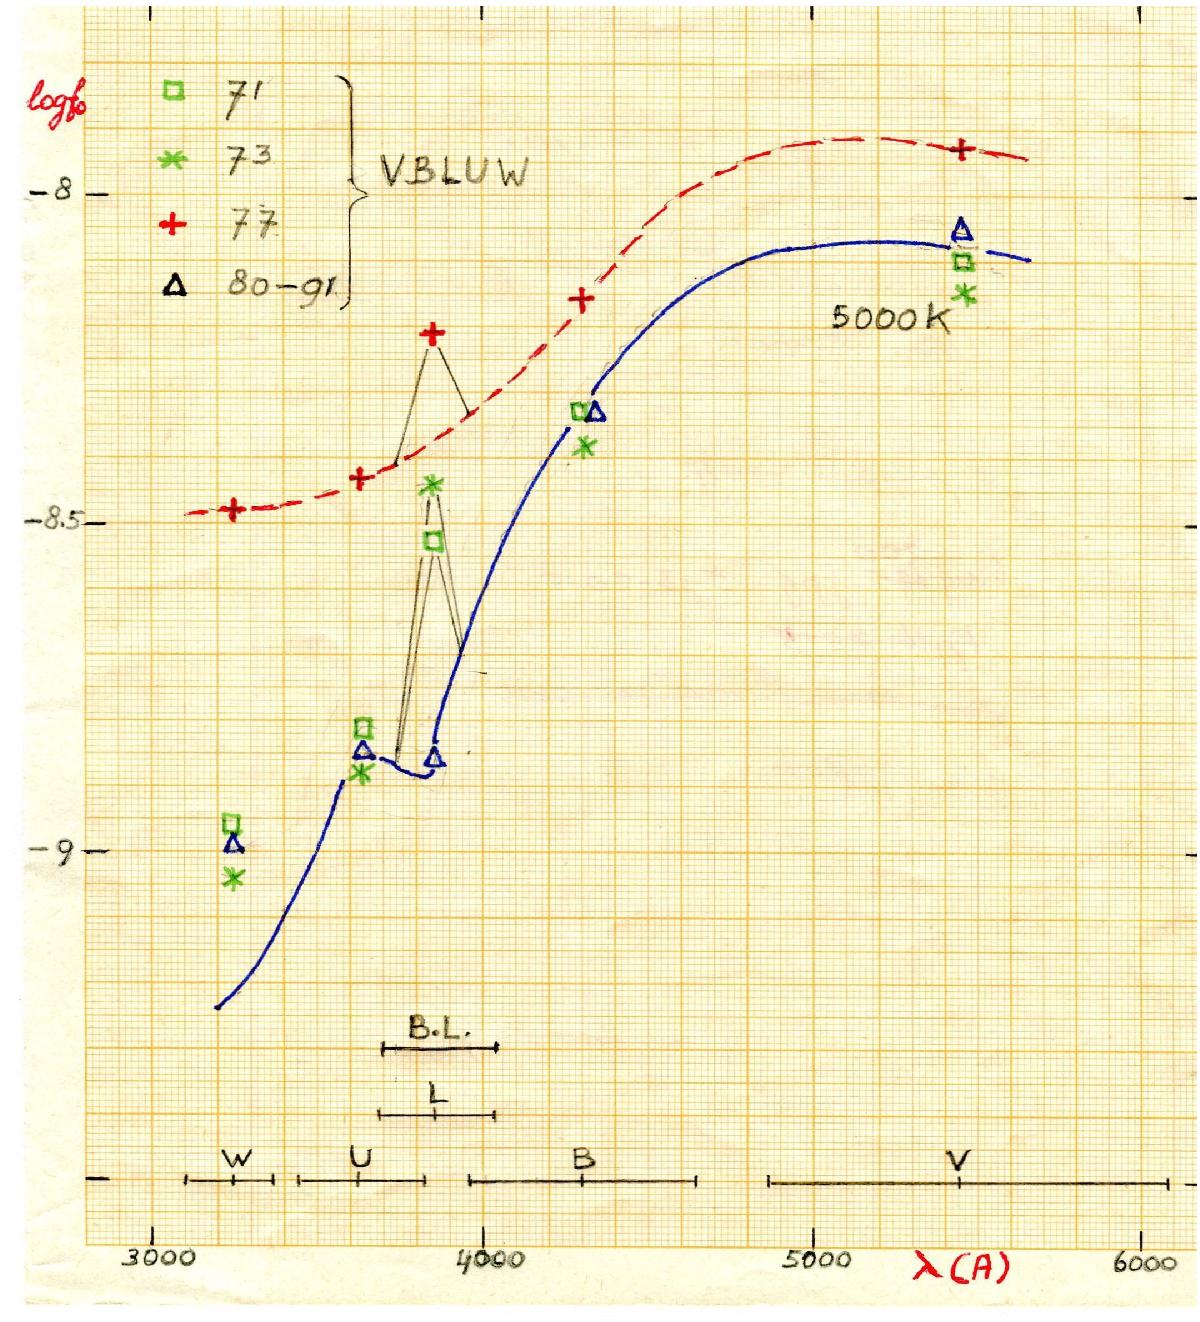
Fluxes log f0 for the VBLUW data sets as a function of the wavelength. The theoretical SED for a star with log g = 0, and T = 5000 K (blue curve) is fitted to the 71, 73 and 80–91 fluxes. The red dashed curve fitting the 77 set fluxes (apart from the L flux as it includes the suspected BL) does not agree with any model. At the bottom, the filter coverage for the VBLUW bands, and the BL spectrum for only the highest peak. The L excesses are indicated with triangular peaks.
Current usage metrics show cumulative count of Article Views (full-text article views including HTML views, PDF and ePub downloads, according to the available data) and Abstracts Views on Vision4Press platform.
Data correspond to usage on the plateform after 2015. The current usage metrics is available 48-96 hours after online publication and is updated daily on week days.
Initial download of the metrics may take a while.