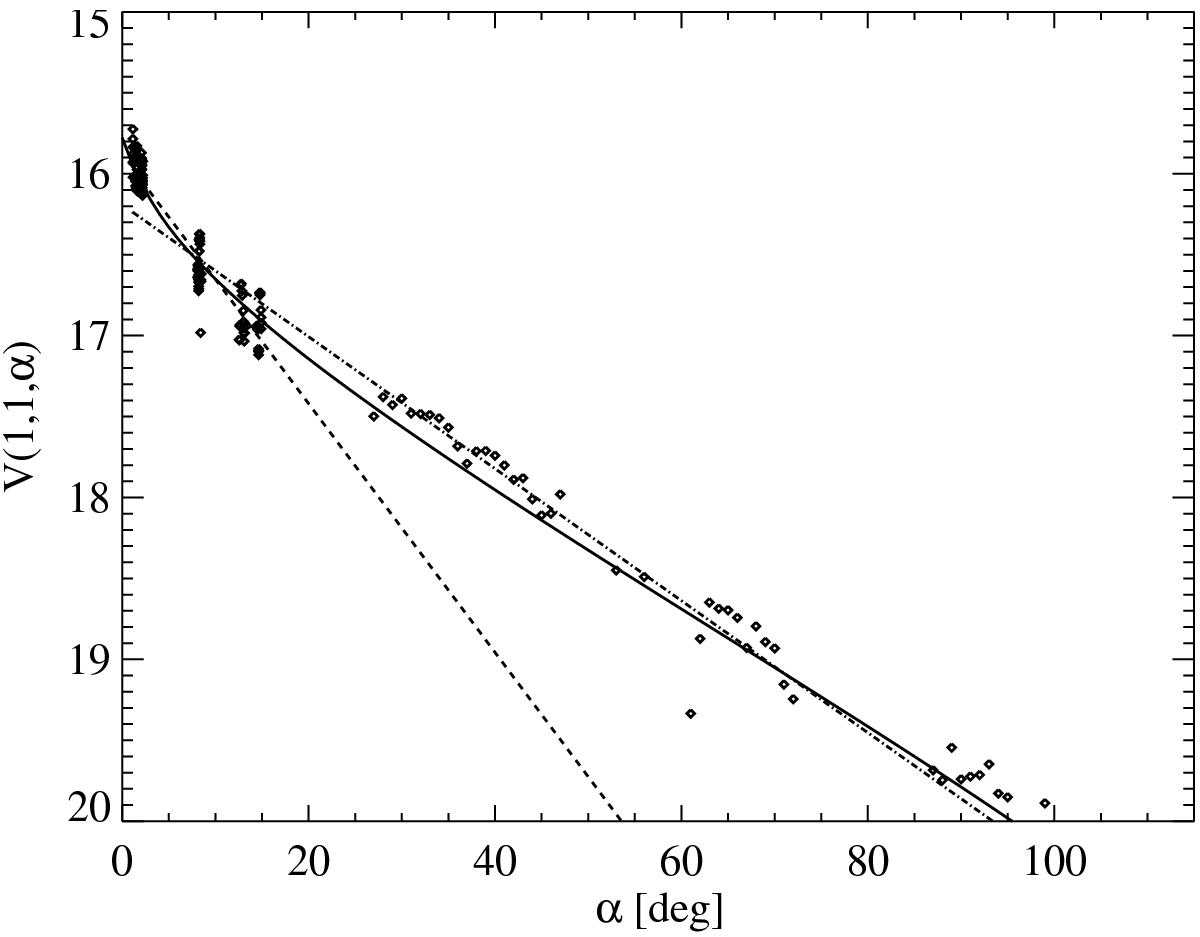
Fig. 22

V-band phase curve. Points with α < 15° are from full-disk images, while points with α > 15° are from disk-resolved data averaged on 1° bins. Dashed and dot-dashed lines represent linear fits of α < 15° and α > 15° data points, respectively. The solid line is the fitted HG curve. Computed errors are typically smaller than the observed scatter of the points and are not shown in the plot because they are not representative of the real uncertainty. The scatter of points at α < 15°, which correspond to integrated fluxes from VIRTIS data, is due to the variable projected cross section of the comet in the different observations. At larger solar phase angles the flux is computed from the average value of the I/F at each given phase angle. The corresponding error, derived as the standard deviation of the I/F distribution at each α normalized to the root of the number of elements in that phase angle bin, is much smaller than the observable scatter, indicating a non-Gaussian behavior.
Current usage metrics show cumulative count of Article Views (full-text article views including HTML views, PDF and ePub downloads, according to the available data) and Abstracts Views on Vision4Press platform.
Data correspond to usage on the plateform after 2015. The current usage metrics is available 48-96 hours after online publication and is updated daily on week days.
Initial download of the metrics may take a while.


