Fig. 7
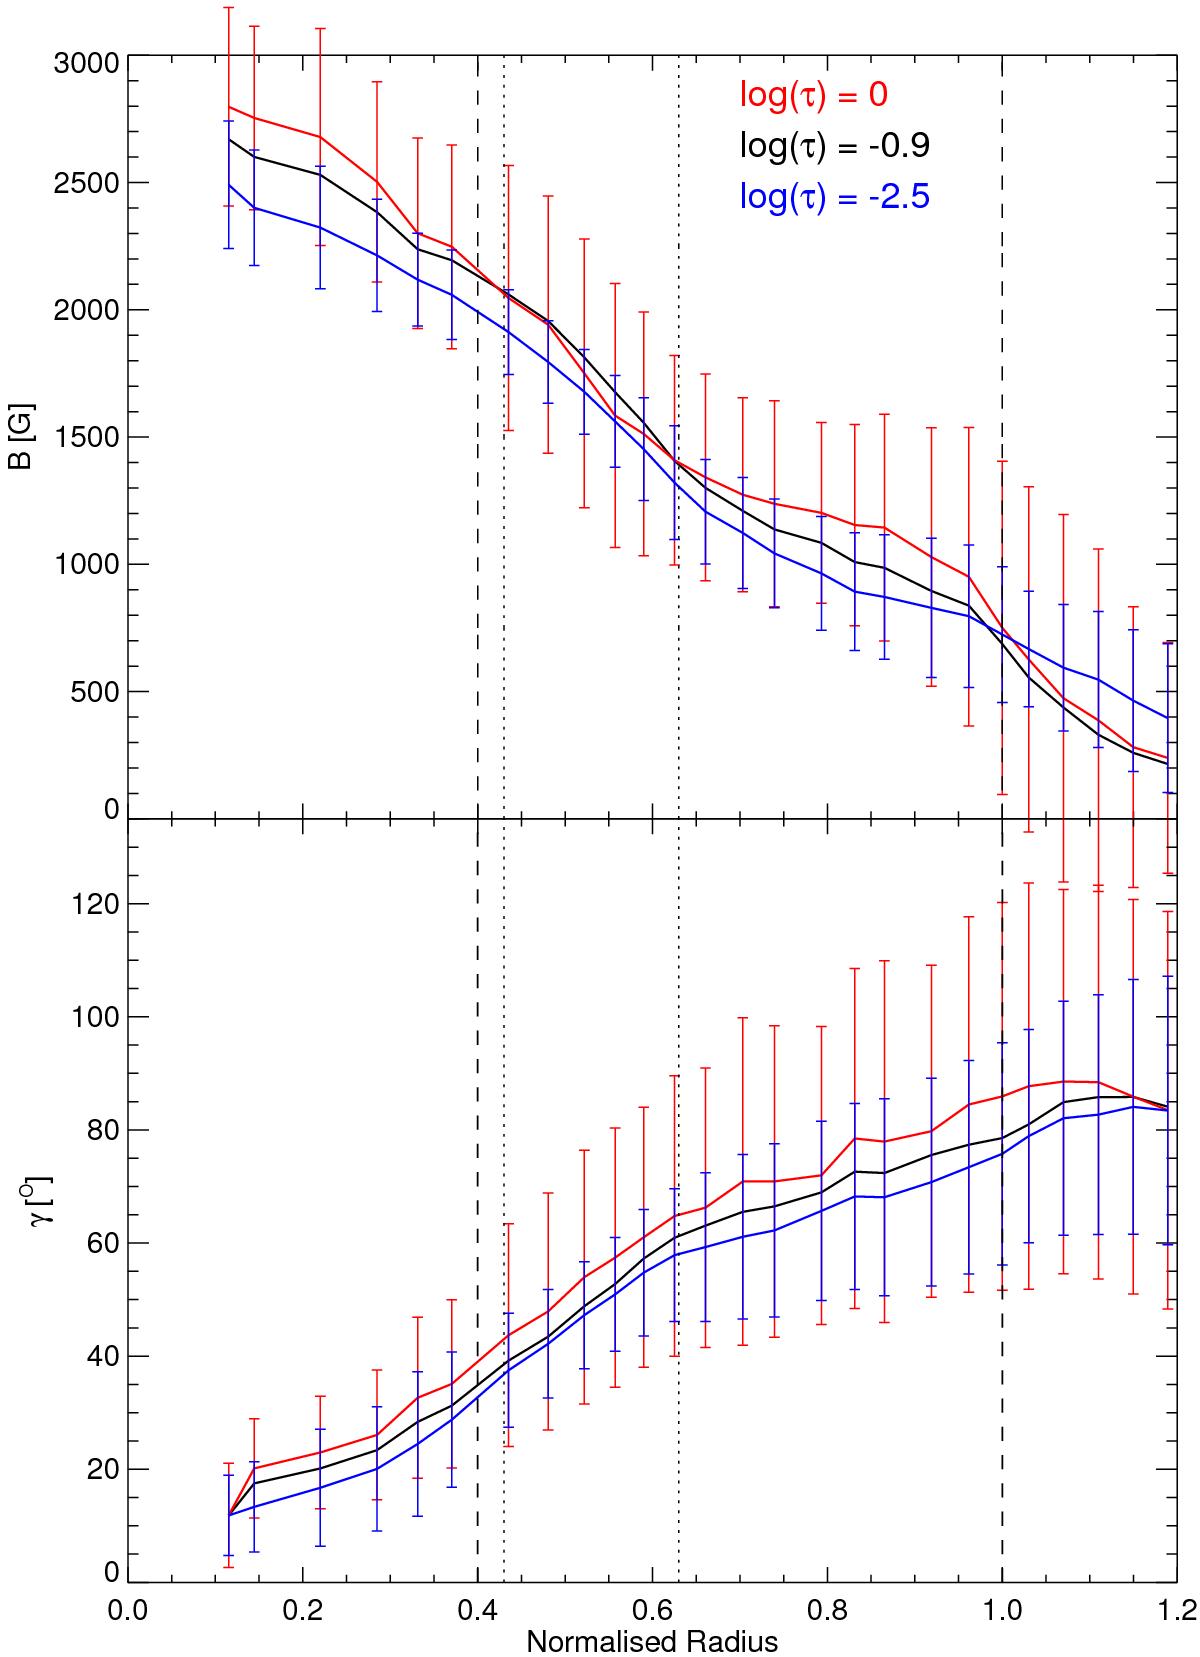
Azimuthal averages of B (upper panel) and γ (lower panel) along the sunspot radius at three optical depths. Also shown are rms variations for the uppermost and lowermost node positions (blue and red error bars, respectively). The two vertical dashed lines represent the inner and outer boundaries of the sunspot penumbra (on average). The two dotted lines outline the radius between which a positive field gradient is seen (i.e., field strength increasing upward).
Current usage metrics show cumulative count of Article Views (full-text article views including HTML views, PDF and ePub downloads, according to the available data) and Abstracts Views on Vision4Press platform.
Data correspond to usage on the plateform after 2015. The current usage metrics is available 48-96 hours after online publication and is updated daily on week days.
Initial download of the metrics may take a while.