Fig. 6
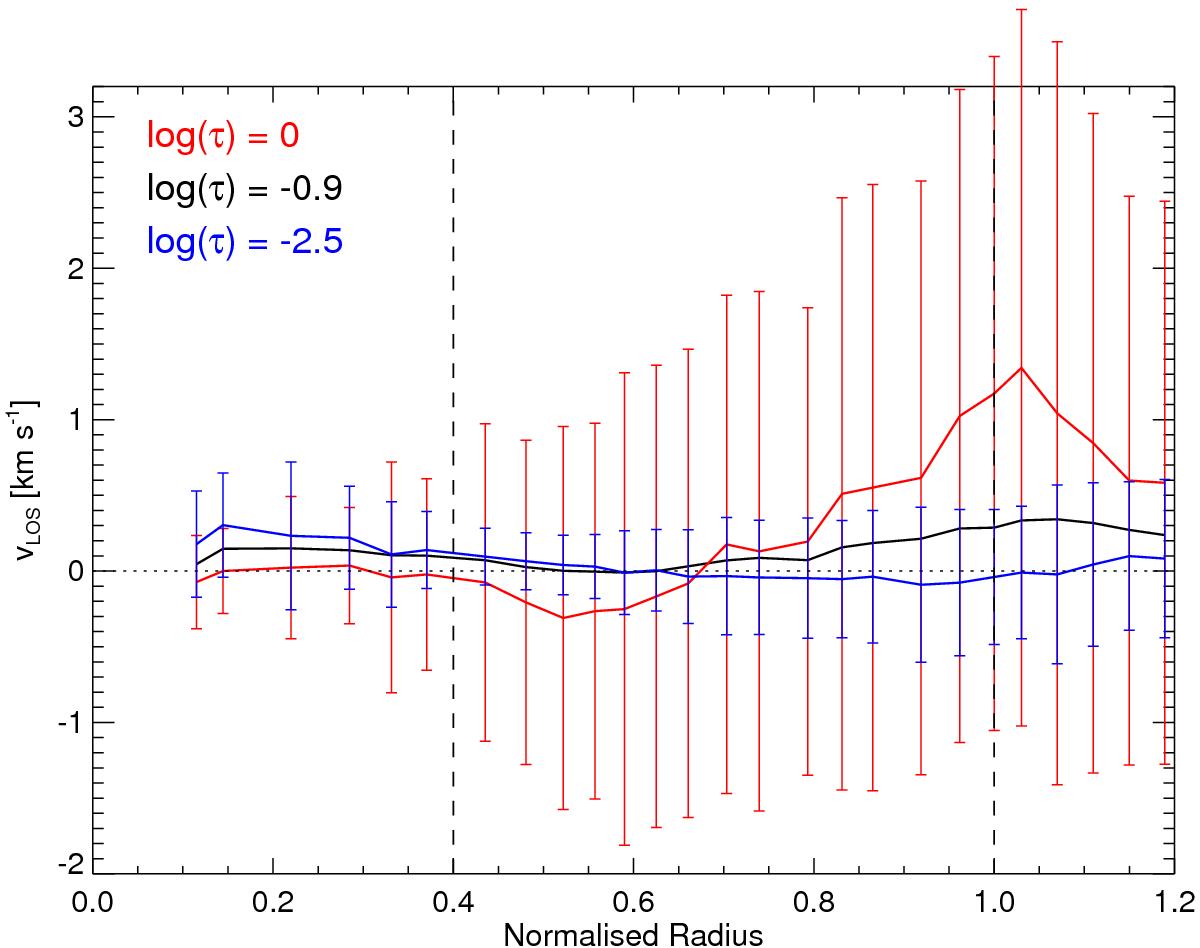
Azimuthal averages of vLOS at three optical depths plotted vs. normalised radial distance from centre of the spot (solid lines). The rms variations along each azimuthal contour are indicated for log (τ) = 0 and −2.5 by the red and blue vertical bars, respectively. The two vertical dashed lines have the same meaning as in Fig. 5.
Current usage metrics show cumulative count of Article Views (full-text article views including HTML views, PDF and ePub downloads, according to the available data) and Abstracts Views on Vision4Press platform.
Data correspond to usage on the plateform after 2015. The current usage metrics is available 48-96 hours after online publication and is updated daily on week days.
Initial download of the metrics may take a while.