Fig. 5
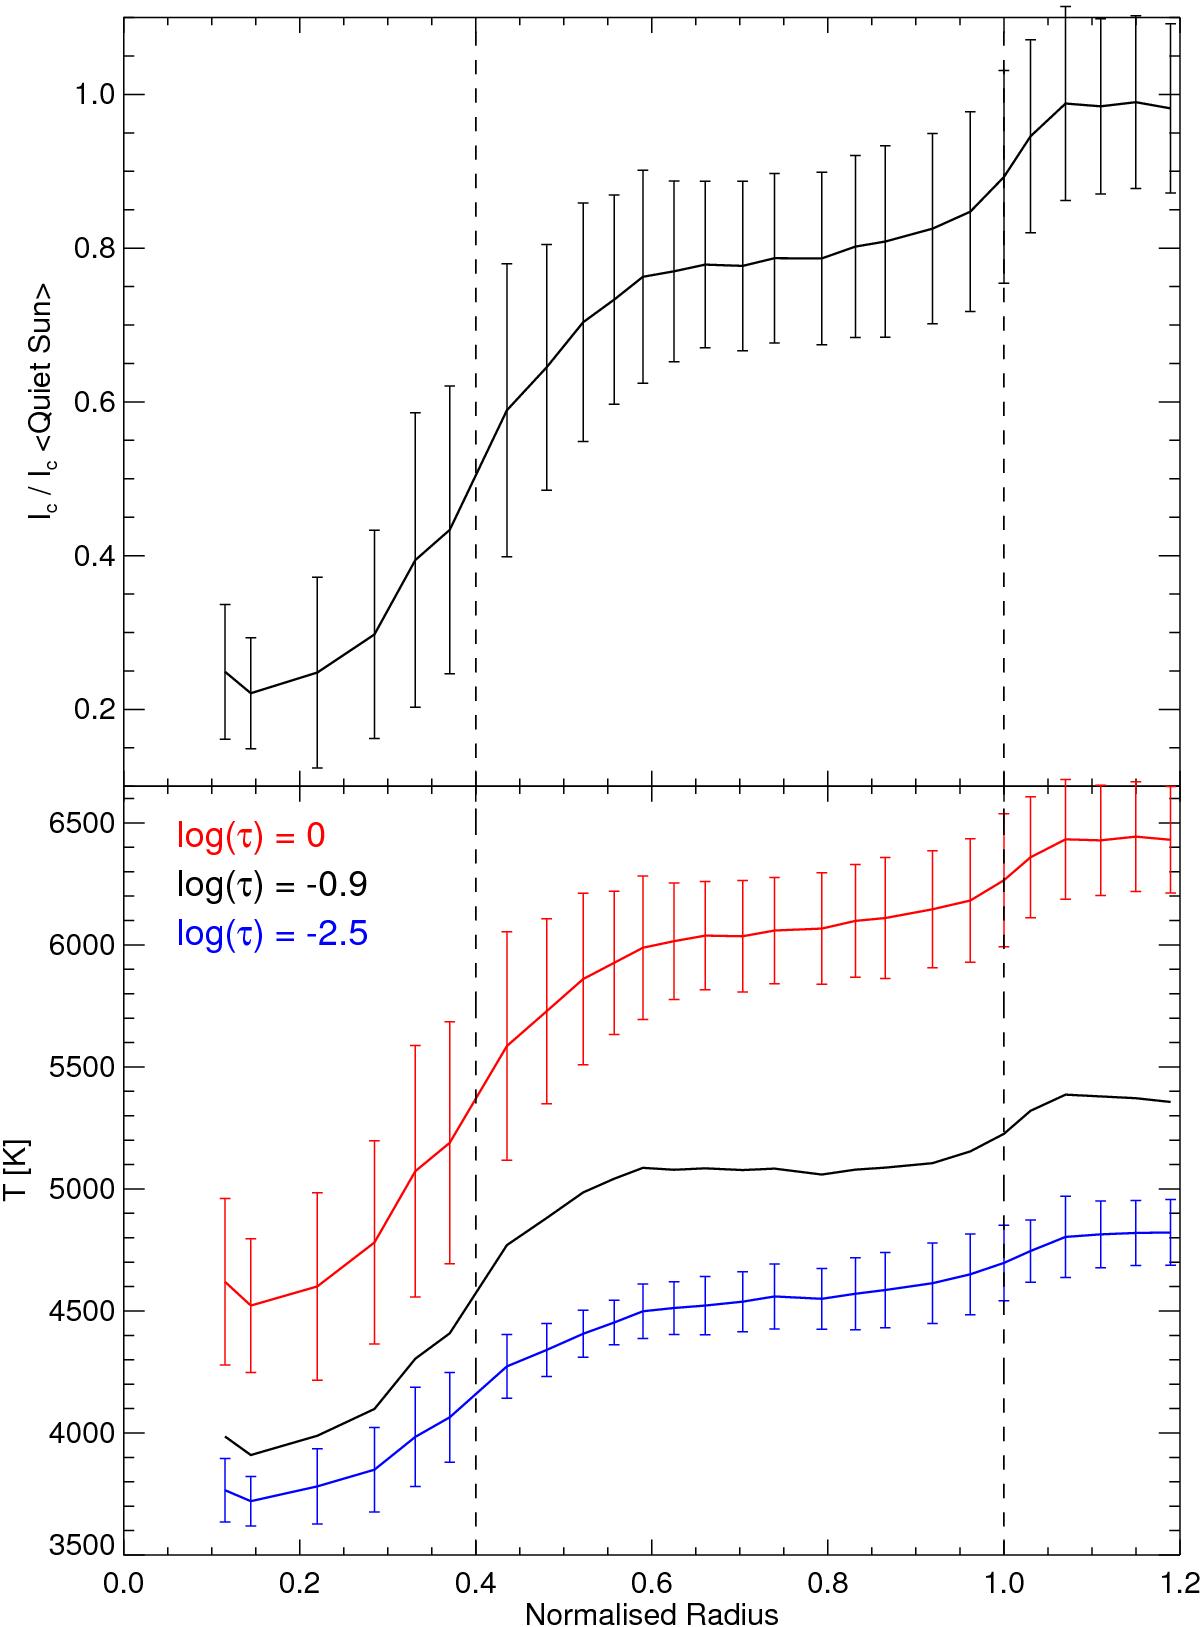
Upper panel: radial distribution of the azimuthally averaged continuum intensity normalised to averaged quiet Sun. The error bars represent the rms variation along the azimuthal path of the contours. Lower panel: radial dependence of the azimuthal averages of temperature at three optical depth positions. The two vertical dashed lines represent average radial positions of the boundaries of the sunspot penumbra.
Current usage metrics show cumulative count of Article Views (full-text article views including HTML views, PDF and ePub downloads, according to the available data) and Abstracts Views on Vision4Press platform.
Data correspond to usage on the plateform after 2015. The current usage metrics is available 48-96 hours after online publication and is updated daily on week days.
Initial download of the metrics may take a while.