Fig. 4
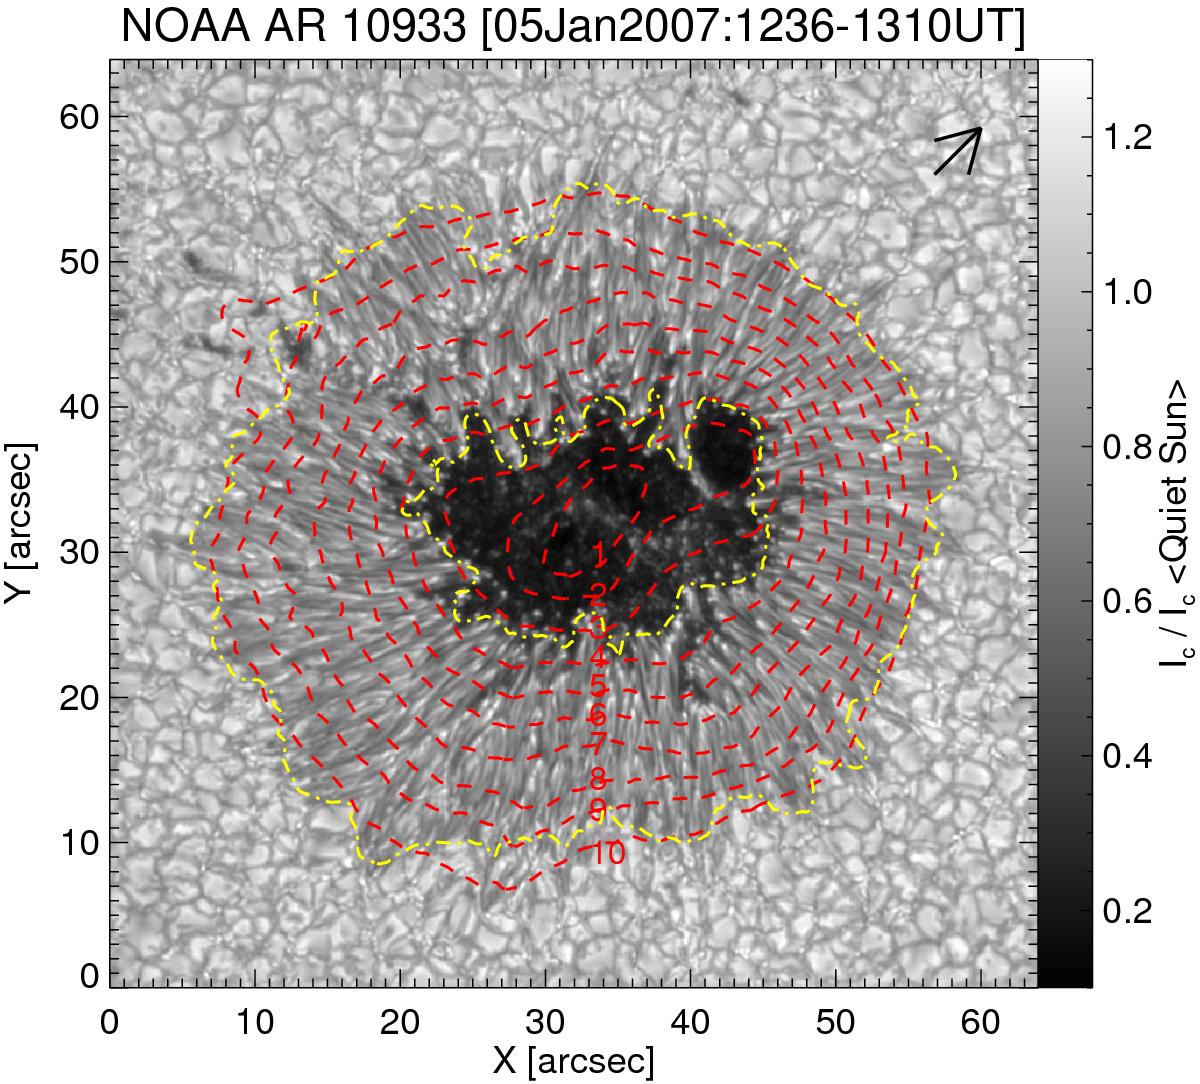
Ten of the 21 contours of magnetic field strength over-plotted on the inverted continuum intensity map. Red contours are based on the smoothed magnetic field strength. Yellow contours are based on the intensity and represent the boundaries of the sunspot penumbra. The greyscale bar ranges from 0.1 to 1.3; the extreme values of Ic/Ic<Quiet Sun> returned from the inversion are 0.097 and 1.468. The black arrow on the upper right part of the image points towards the solar disk centre.
Current usage metrics show cumulative count of Article Views (full-text article views including HTML views, PDF and ePub downloads, according to the available data) and Abstracts Views on Vision4Press platform.
Data correspond to usage on the plateform after 2015. The current usage metrics is available 48-96 hours after online publication and is updated daily on week days.
Initial download of the metrics may take a while.