Fig. 16
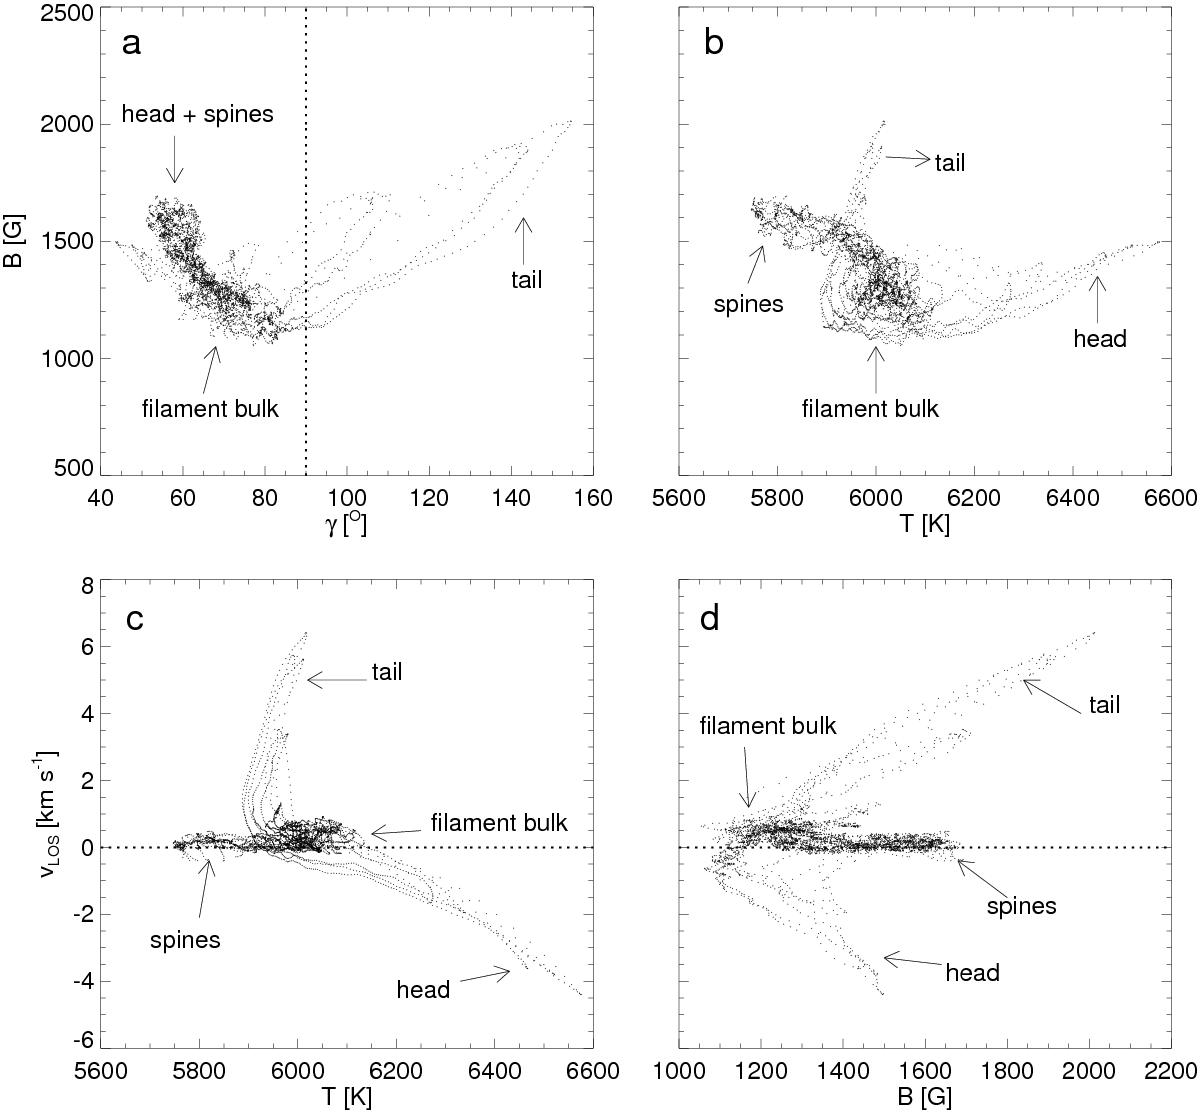
Scatter plots of different physical parameters of the standard penumbral filament studied by Tiwari et al. (2013). The selected area also contains pixels belonging to the surroundings of the filament (spines). All plots are for the height log (τ) = 0. The four panels show scatter plots between: a) the field strength B and inclination γ; b) B and temperature T; c) the line-of-sight velocity vLOS and T; and d) vLOS and B. The vertical line in a) indicates γ = 90°; horizontal lines in panels c) and d) represent vLOS = 0. Different parts of the filaments are identified in each plot.
Current usage metrics show cumulative count of Article Views (full-text article views including HTML views, PDF and ePub downloads, according to the available data) and Abstracts Views on Vision4Press platform.
Data correspond to usage on the plateform after 2015. The current usage metrics is available 48-96 hours after online publication and is updated daily on week days.
Initial download of the metrics may take a while.