Fig. 14
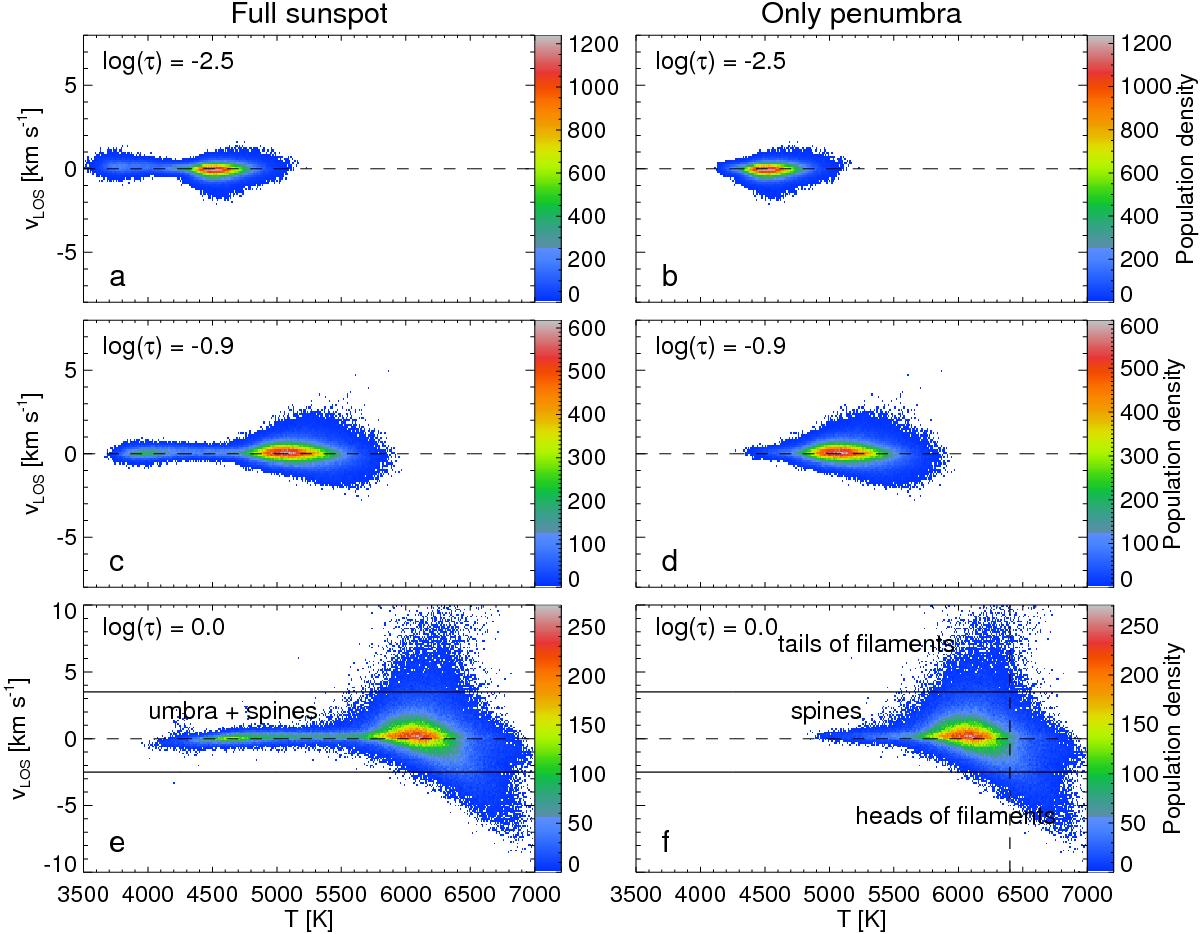
Left panels: 2D scatter plots of T vs. vLOS for all points within the sunspot boundary at the three optical depth nodes. The horizontal dashed line in each panel indicates the zero velocity level. In each panel, the points at lower temperature belong to the sunspot umbra and also to spines, while those at higher temperature belong only to the penumbra. Right panels: the same, but only showing penumbral pixels. The two horizontal solid lines are used to separate, in an approximative manner, the heads (lying below the lower solid line) and tails of penumbral filaments (above the upper solid line) from the other points. The dashed vertical line in f) represents T = 6400 K, a condition applied to isolate the heads of penumbral filaments in Fig. 12d, although it also includes points from the bulks of the filaments (points to the right of the vertical dashed line lying between the two horizontal solid lines).
Current usage metrics show cumulative count of Article Views (full-text article views including HTML views, PDF and ePub downloads, according to the available data) and Abstracts Views on Vision4Press platform.
Data correspond to usage on the plateform after 2015. The current usage metrics is available 48-96 hours after online publication and is updated daily on week days.
Initial download of the metrics may take a while.