Fig. 12
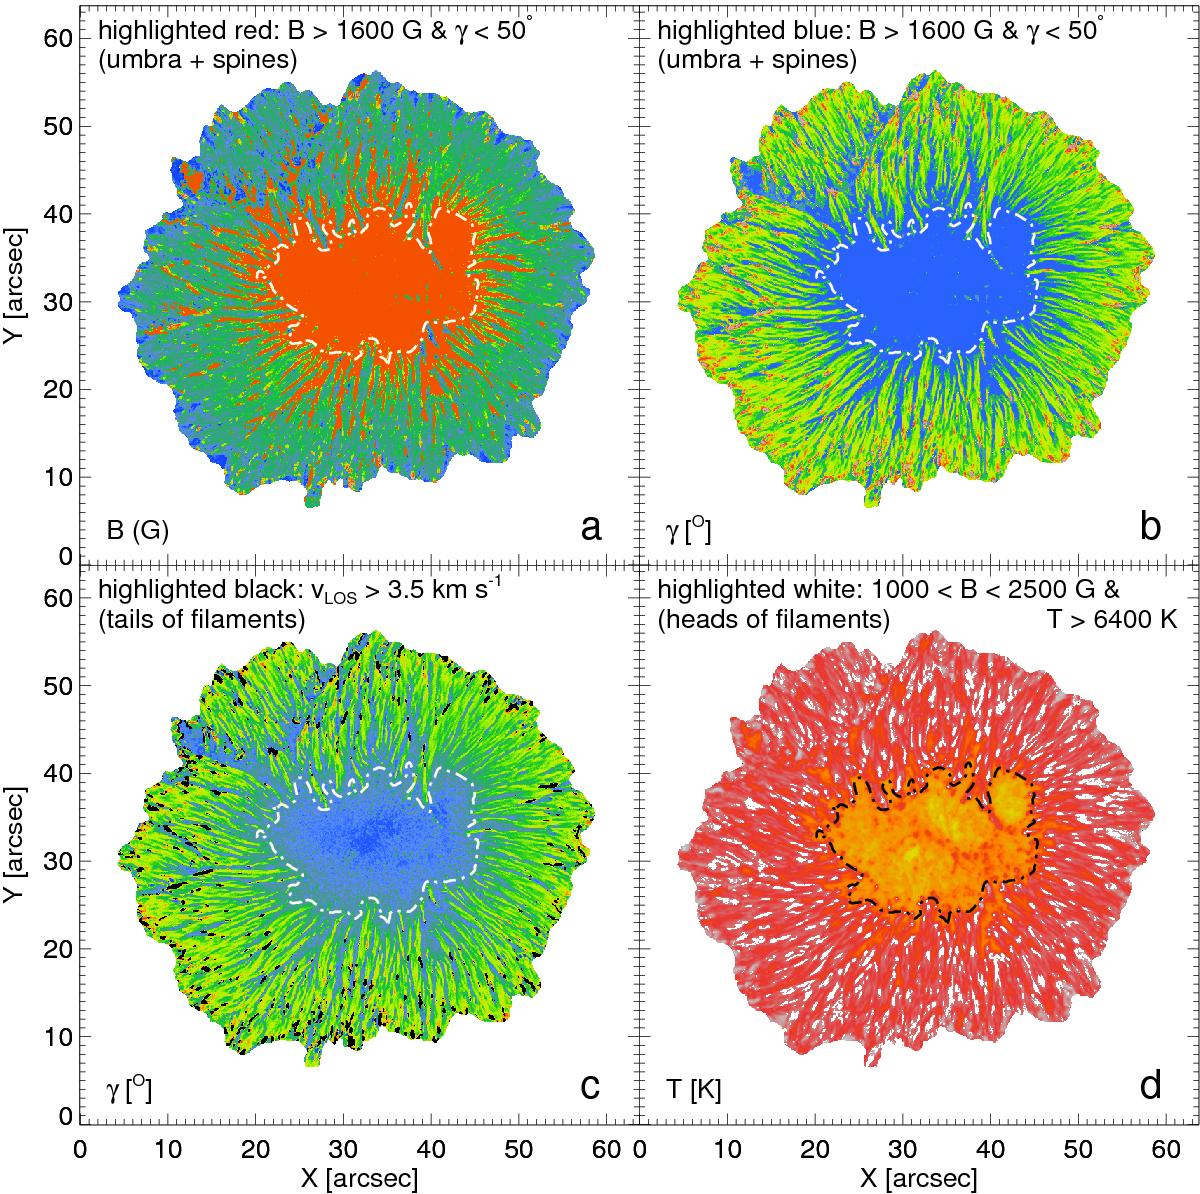
a) Map of magnetic field strength at log (τ) = 0. The pixels with B> 1600 G and γ< 50° are highlighted in red (i.e. the pixels in the box outlined in black in Figs. 11e and 10f). b) Field inclination map at log (τ) = 0. with pixels satisfying the same conditions as applied to the field strength map in panel a) highlighted in blue. The colour scheme for the field inclination map is chosen for consistency with the field inclination map depicted in Fig. 3. c) Same map as displayed in b) but pixels with vLOS> 3.5 km s-1 are highlighted in black, revealing tails of penumbral filaments. d) Map of temperature at log (τ) = 0. Highlighted in white are pixels satisfying T> 6400 K and 1000 <B< 2500 G, basically representing heads and warm parts of bulks of penumbral filaments. The dash-dotted contour in each panel represents the umbra-penumbra boundary.
Current usage metrics show cumulative count of Article Views (full-text article views including HTML views, PDF and ePub downloads, according to the available data) and Abstracts Views on Vision4Press platform.
Data correspond to usage on the plateform after 2015. The current usage metrics is available 48-96 hours after online publication and is updated daily on week days.
Initial download of the metrics may take a while.