Fig. 11
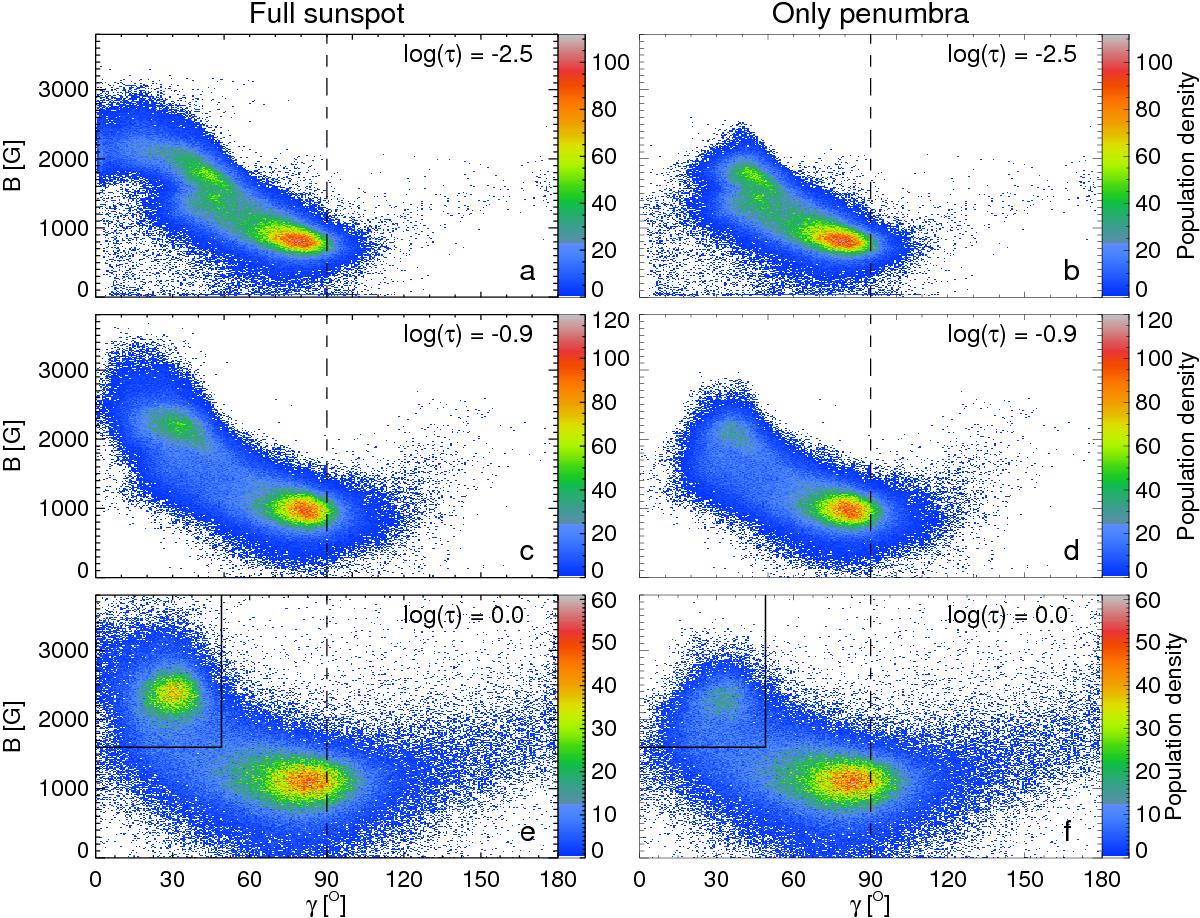
Left panels: 2D scatter plots of B vs. γ for all points within the sunspot’s boundary at the three optical depth nodes (from top to bottom, log (τ) = −2.5,−0.9,0). Right panels: the same but only for pixels in the penumbra. The vertical dashed line in each panel represents the location of γ = 90°. A black box is drawn at log (τ) = 0 to identify/outline the umbral pixels, spine pixels in f) (see Figs. 12a and b for where these pixels are located in the sunspot).
Current usage metrics show cumulative count of Article Views (full-text article views including HTML views, PDF and ePub downloads, according to the available data) and Abstracts Views on Vision4Press platform.
Data correspond to usage on the plateform after 2015. The current usage metrics is available 48-96 hours after online publication and is updated daily on week days.
Initial download of the metrics may take a while.