Fig. 2
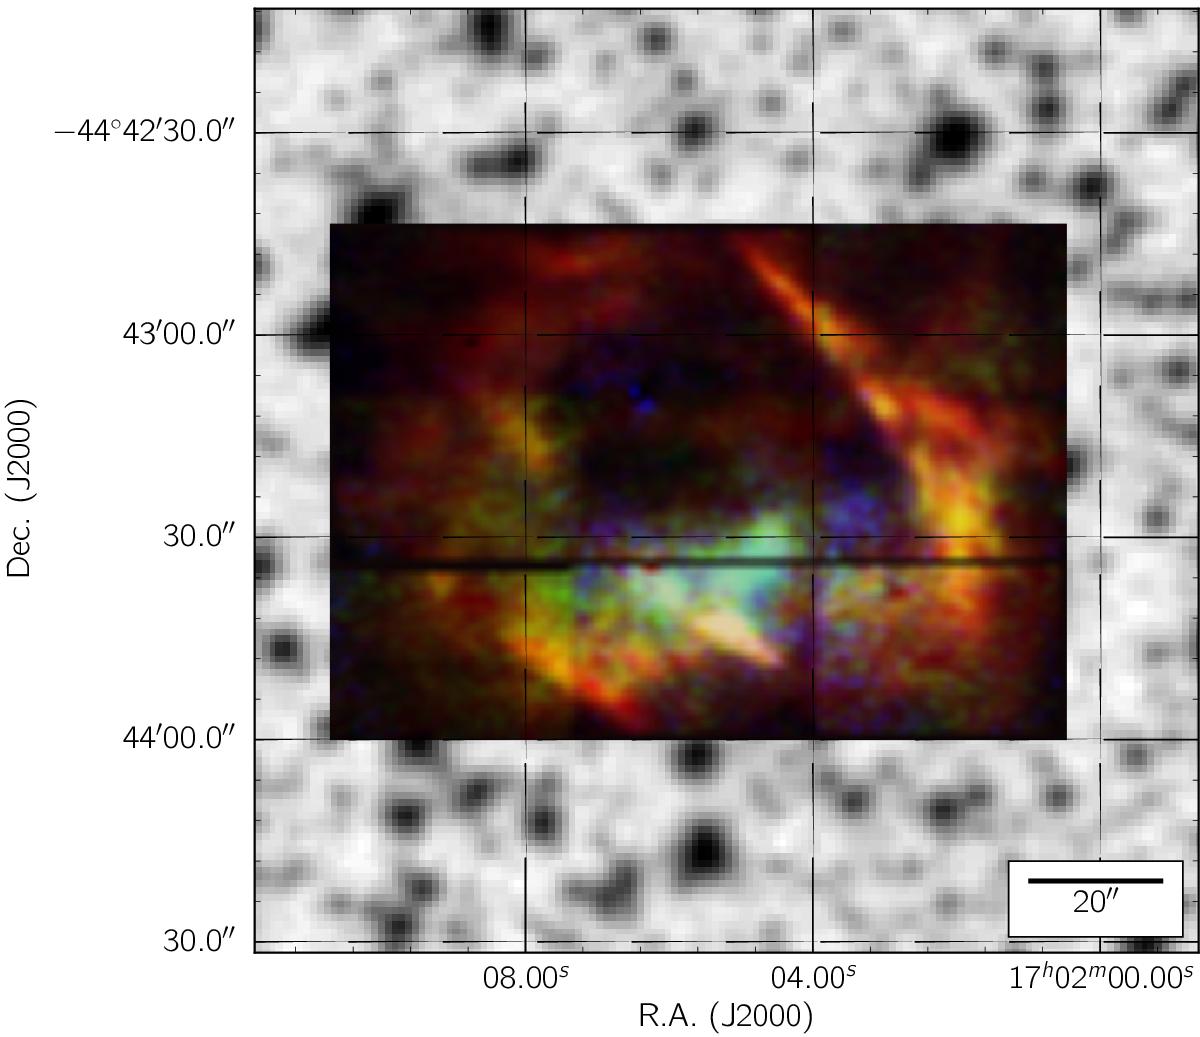
WiFeS emission line map of the PN G342.0-01.7 superimposed on the DSS-2 (red) stellar field. The image is a mosaic of the 9 observed positions on the nebula, where each frame has a field of view 25′′× 38′′. The colour image is a composite of [NII] (red) Hα (green) and [OIII] (blue), and reflects the excitation structure of the nebula. The horizontal gap results from a pointing offset error between the first and second night’s observations.
Current usage metrics show cumulative count of Article Views (full-text article views including HTML views, PDF and ePub downloads, according to the available data) and Abstracts Views on Vision4Press platform.
Data correspond to usage on the plateform after 2015. The current usage metrics is available 48-96 hours after online publication and is updated daily on week days.
Initial download of the metrics may take a while.