Fig. 2
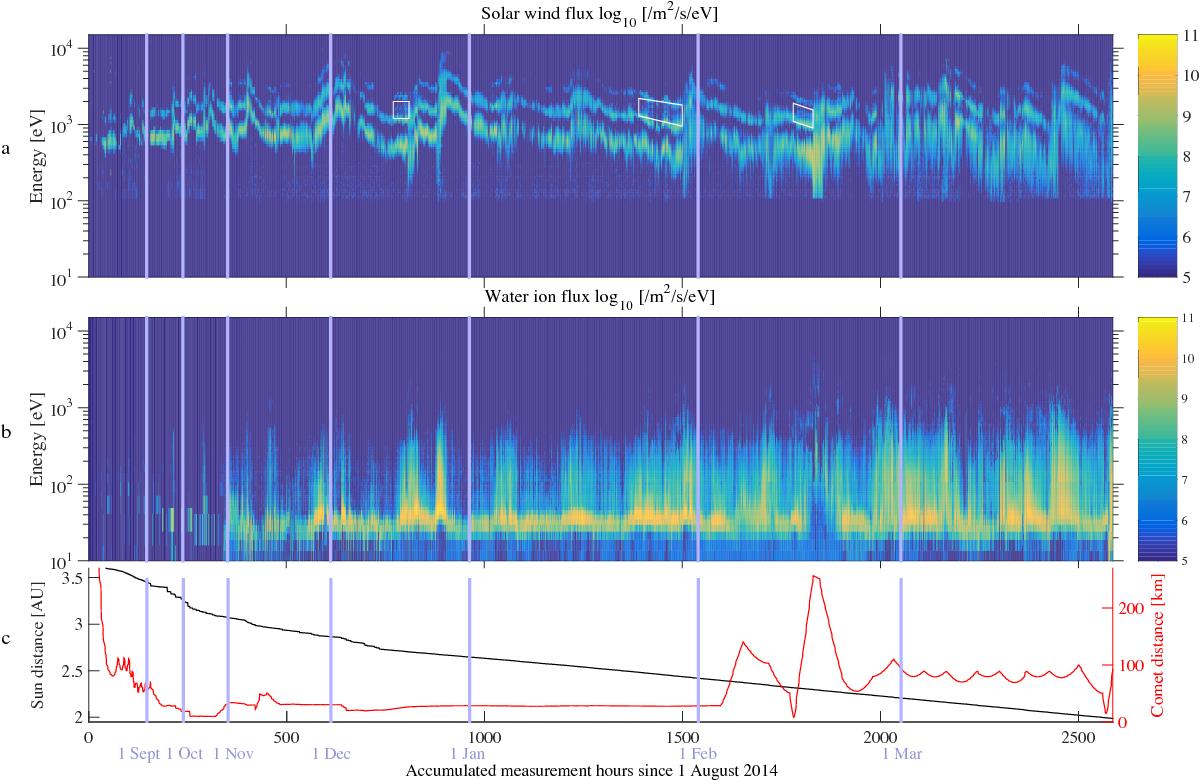
Energy spectrograms summed over all viewing directions and integrated over one hour for a) solar wind ions and b) water group ions [m-2 s-1 eV-1]. Panel c) shows the distance to the comet (red line, right y axis, in km) and the heliocentric distance (black line, left y axis, in AU). The blue vertical lines indicate the start of each month in the dataset. The x axis shows accumulated hours of measurements since 1 August 2014. Note that the timescale is not linear since data gaps were removed. In panel a), the white transparent boxes indicate where O6+ (m/q = 2.7) ions were detected by RPC-ICA. They appear as a weak signal around 1.5 keV, between two stronger signals (He2+ and He+).
Current usage metrics show cumulative count of Article Views (full-text article views including HTML views, PDF and ePub downloads, according to the available data) and Abstracts Views on Vision4Press platform.
Data correspond to usage on the plateform after 2015. The current usage metrics is available 48-96 hours after online publication and is updated daily on week days.
Initial download of the metrics may take a while.