Fig. 3
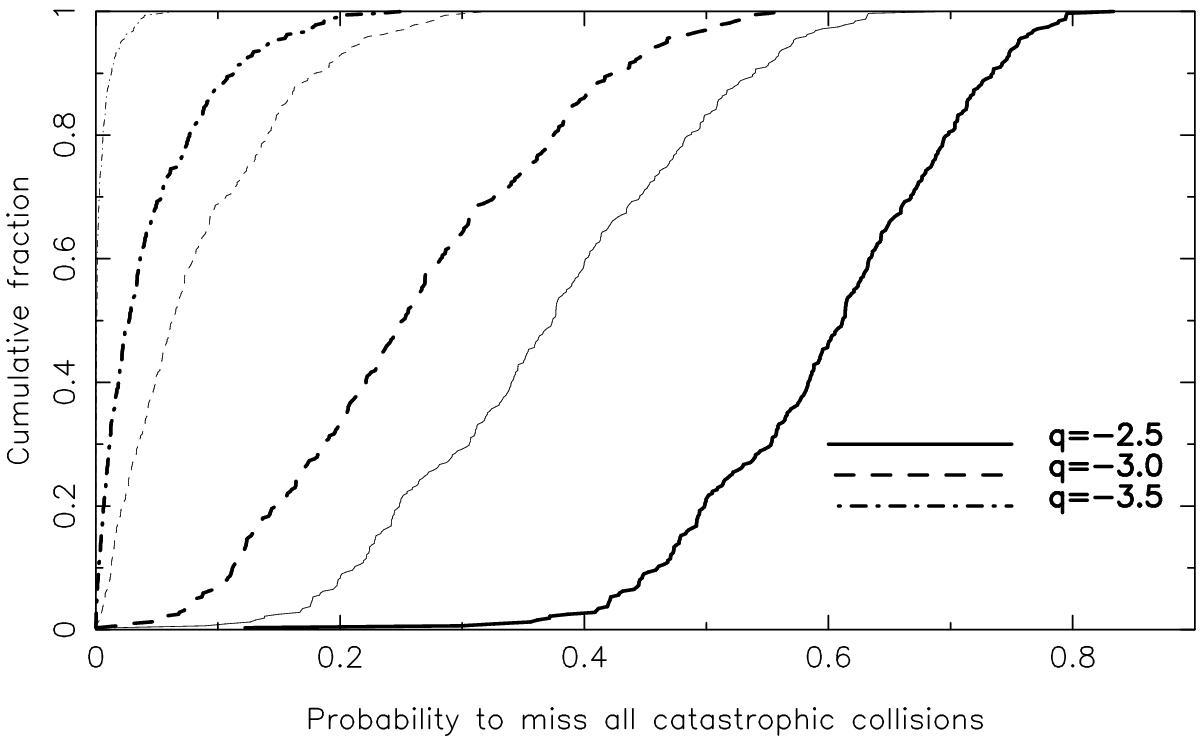
Fraction of particles ending in the scattered disk with a probability of escaping all catastrophic collisions P(0) lower than that indicated on the horizontal axis. This is an alternative representation of the results shown in Fig. 2. The different line styles refer to different exponents for the differential size distribution q, as labeled in the plot. The thick curves correspond to the value of Q∗ given in Benz & Asphaug (1999) and the thin curves to a Q∗ value four times lower, as in Leinhardt & Stewart (2009) with the velocity scaling provided in Stewart & Leinhardt (2009).
Current usage metrics show cumulative count of Article Views (full-text article views including HTML views, PDF and ePub downloads, according to the available data) and Abstracts Views on Vision4Press platform.
Data correspond to usage on the plateform after 2015. The current usage metrics is available 48-96 hours after online publication and is updated daily on week days.
Initial download of the metrics may take a while.