Fig. 8
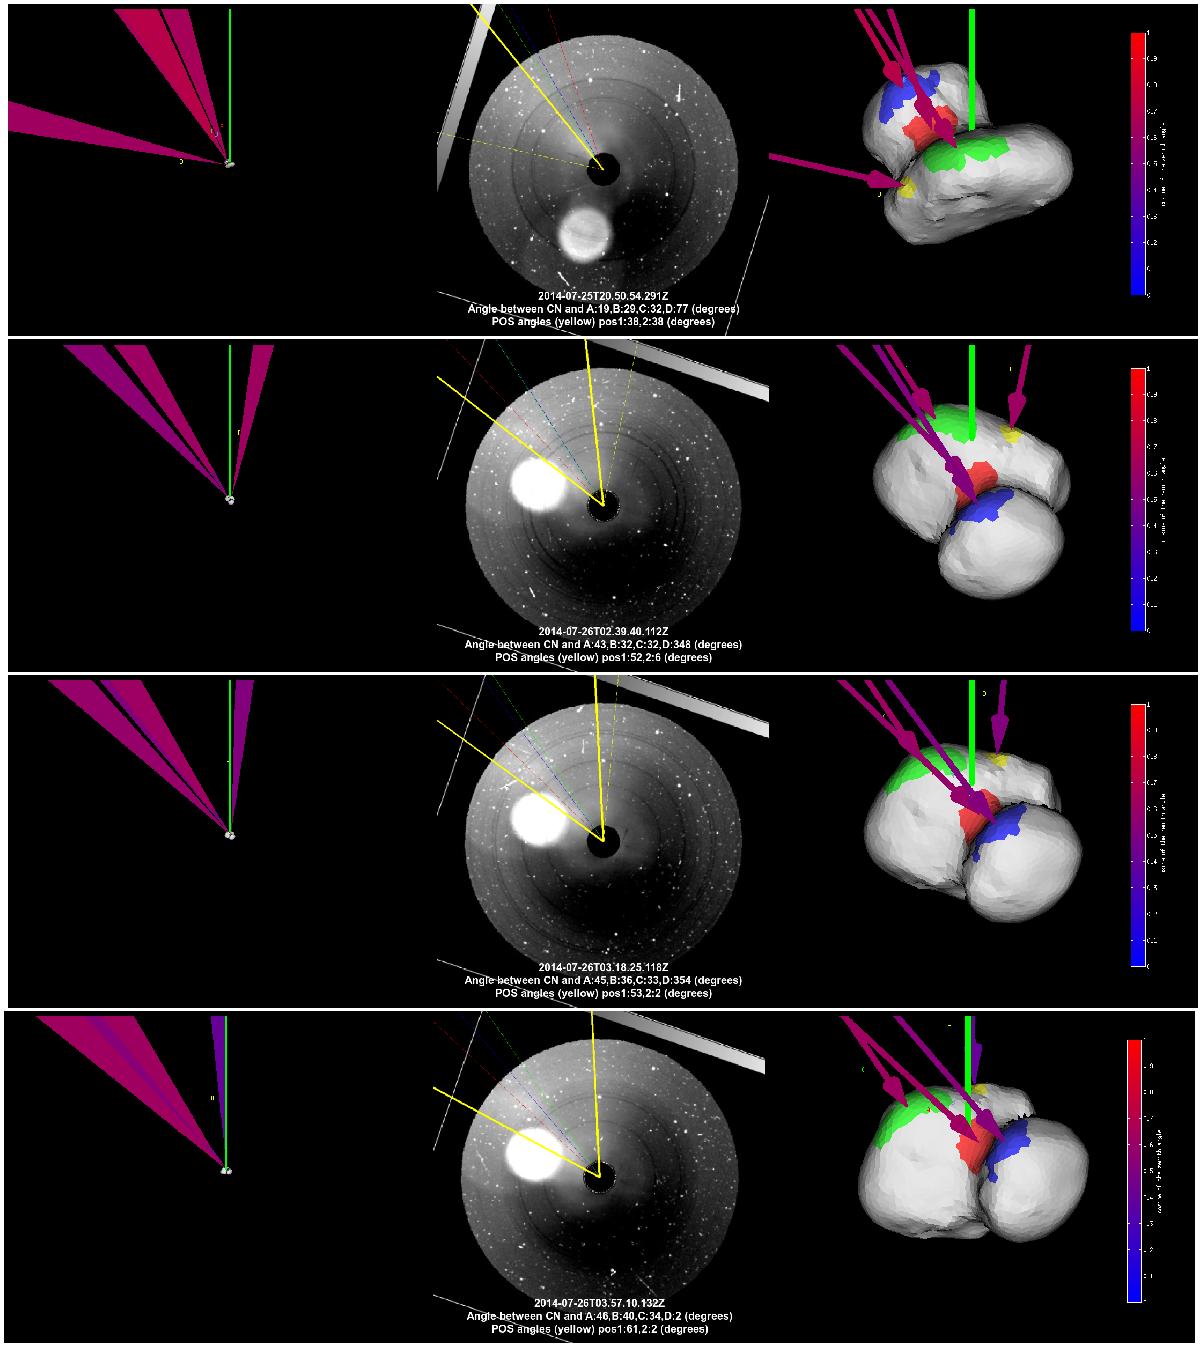
Selected examples of the projection of jets from the source regions in Figs. 5−7 onto the observing plane of processed OSIRIS images (from the July 25–26, 2014 data set). In the lower three panels we see signs of an additional faint jet from the Aten region of the nucleus. The source region of this jet is shown in yellow in the panels above. See Sect. 3.2 for details.
Current usage metrics show cumulative count of Article Views (full-text article views including HTML views, PDF and ePub downloads, according to the available data) and Abstracts Views on Vision4Press platform.
Data correspond to usage on the plateform after 2015. The current usage metrics is available 48-96 hours after online publication and is updated daily on week days.
Initial download of the metrics may take a while.