Fig. 5
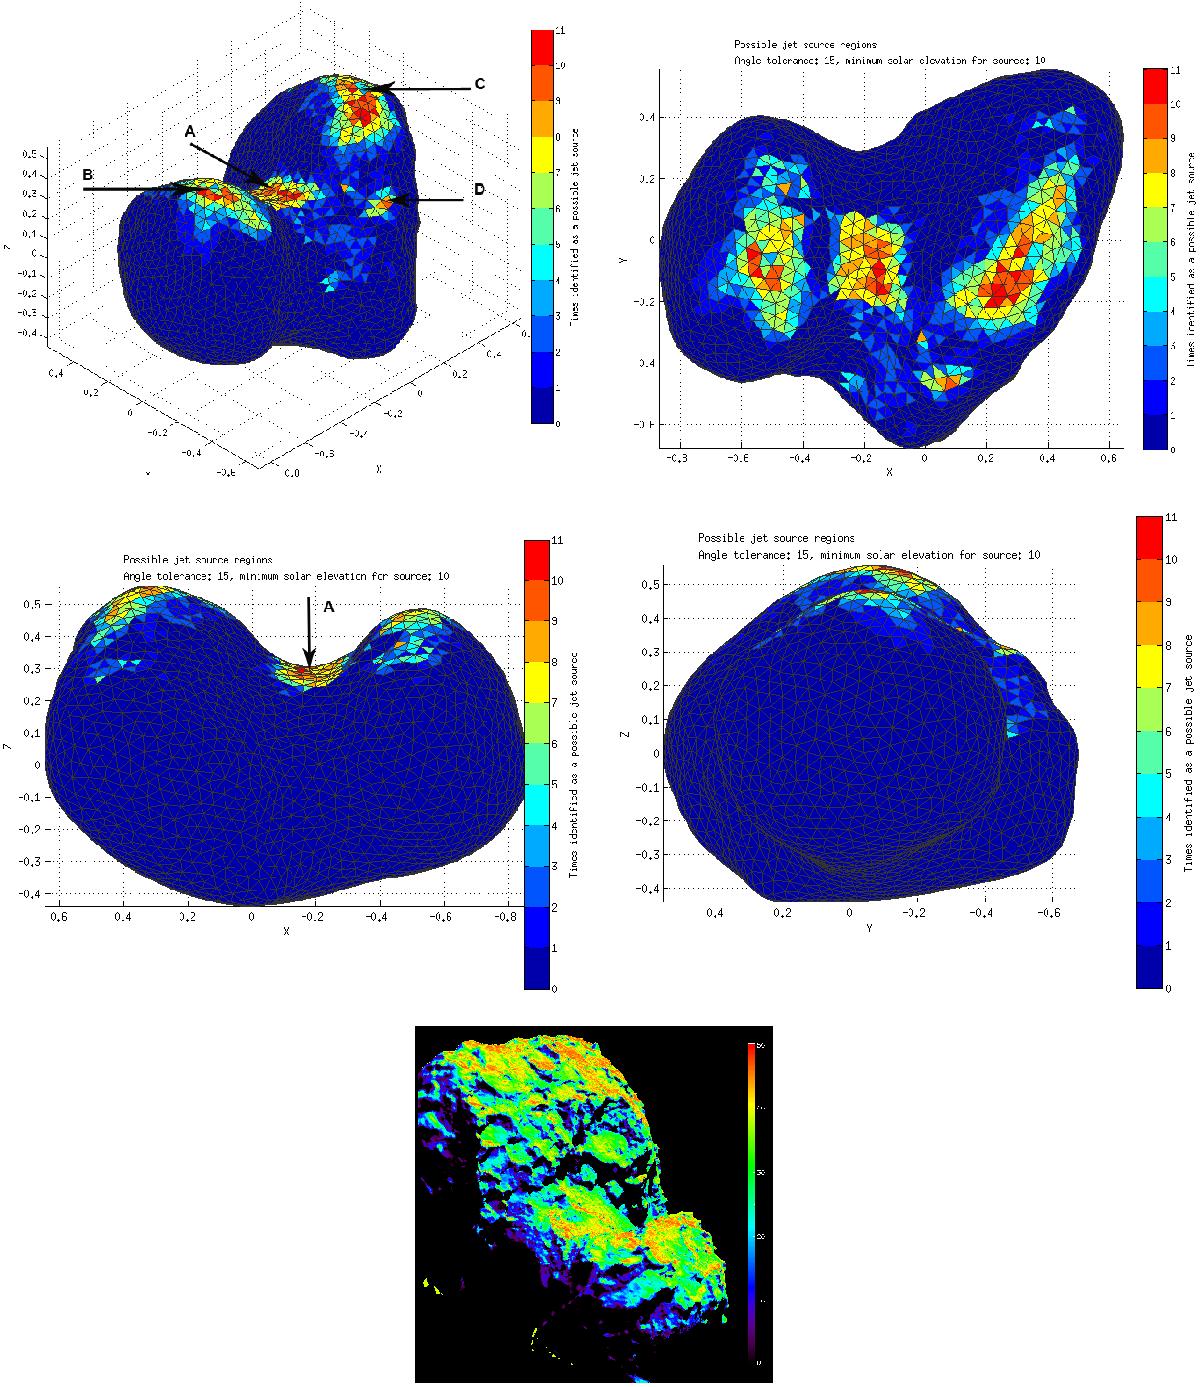
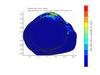
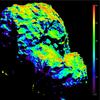
Nucleus jet-source regions determined using method 2 for the July 25–26 data set. For comparison, the solar elevation (in degrees) averaged over the time frame covered by the above mentioned data set is also shown. We note that most of the insolation occurs at regions where the detected jet-like features originate from the nucleus, but not all areas with relatively high insolation levels produce a jet source region.
Current usage metrics show cumulative count of Article Views (full-text article views including HTML views, PDF and ePub downloads, according to the available data) and Abstracts Views on Vision4Press platform.
Data correspond to usage on the plateform after 2015. The current usage metrics is available 48-96 hours after online publication and is updated daily on week days.
Initial download of the metrics may take a while.