Fig. 4
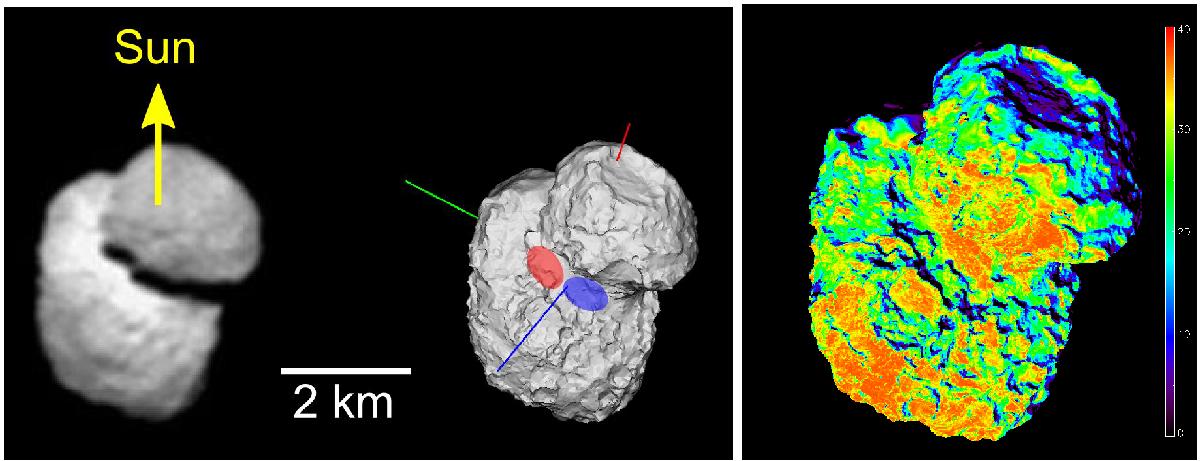
Results of the inversion technique described in Sect. 3.1. The left image shows a NAC image acquired on 21 July 2014 (spacecraft distance =4530 km, resolution =100 m/px). The middle image shows the shape model in the same observing configuration. Red, green, and blue lines indicate the X, Y, and Z axes of the model, respectively, with Z being the positive spin axis. The red and blue ellipses mark the locations of jet sources. The right panel displays the solar elevation (in degrees) averaged over the time frame covered by the images obtained on July 20–21. We note that most of the insolation occurs at regions where the detected jet-like features originate from the nucleus, but not all areas with relatively high insolation levels produce a jet source region.
Current usage metrics show cumulative count of Article Views (full-text article views including HTML views, PDF and ePub downloads, according to the available data) and Abstracts Views on Vision4Press platform.
Data correspond to usage on the plateform after 2015. The current usage metrics is available 48-96 hours after online publication and is updated daily on week days.
Initial download of the metrics may take a while.