Fig. 5
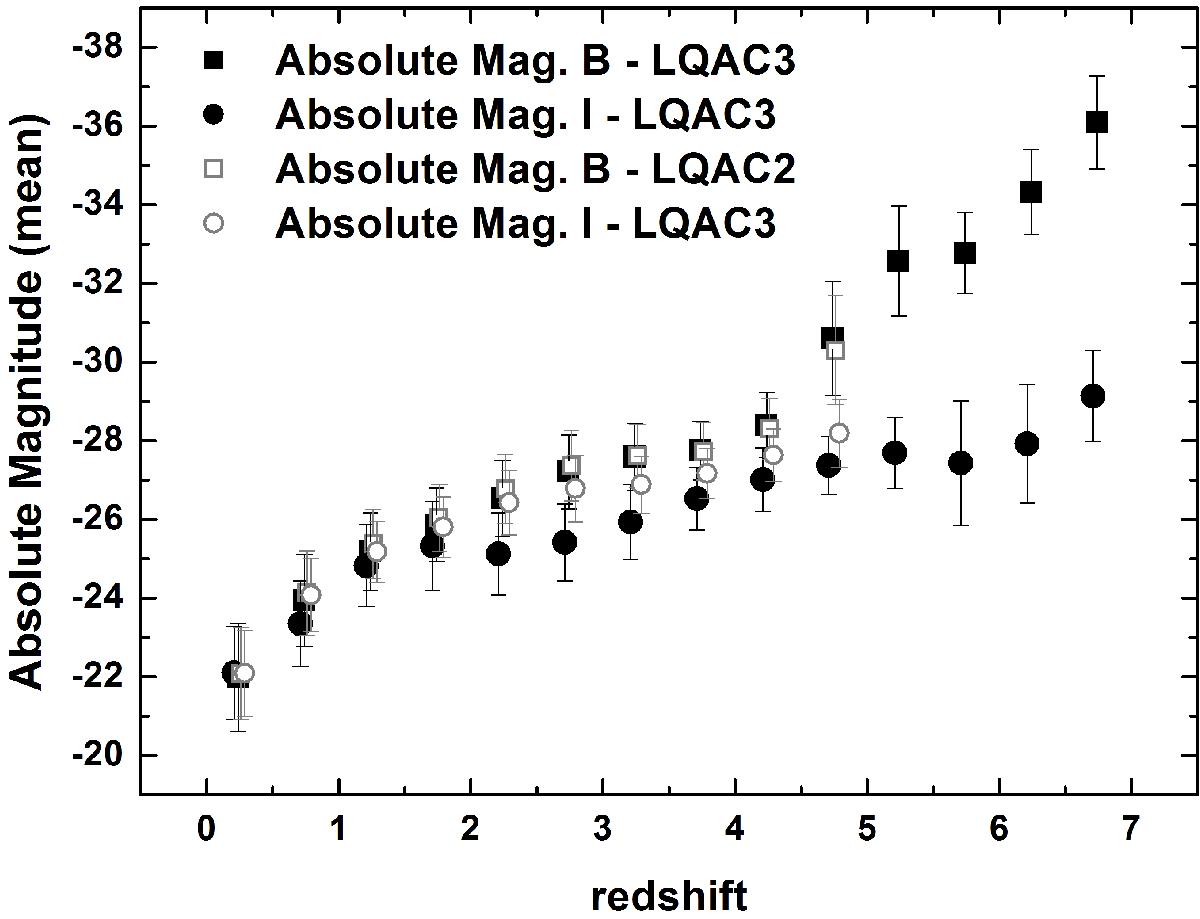
Distribution of the mean absolute magnitudes per bin of redshift. Only sources for which both B and I absolute magnitudes were determined are considered to the mean. Also shown is the same distribution as for the sources in the earlier version LQAC2 – that is, without the SDSS BOSS sources – and no net variation appears. The interesting asymmetry between the B and I distributions after redshift 5 must be taken with caution owing to the small number of elements in those bins. Symbols are slightly offset but refer to the same redshift bin.
Current usage metrics show cumulative count of Article Views (full-text article views including HTML views, PDF and ePub downloads, according to the available data) and Abstracts Views on Vision4Press platform.
Data correspond to usage on the plateform after 2015. The current usage metrics is available 48-96 hours after online publication and is updated daily on week days.
Initial download of the metrics may take a while.