Fig. 7
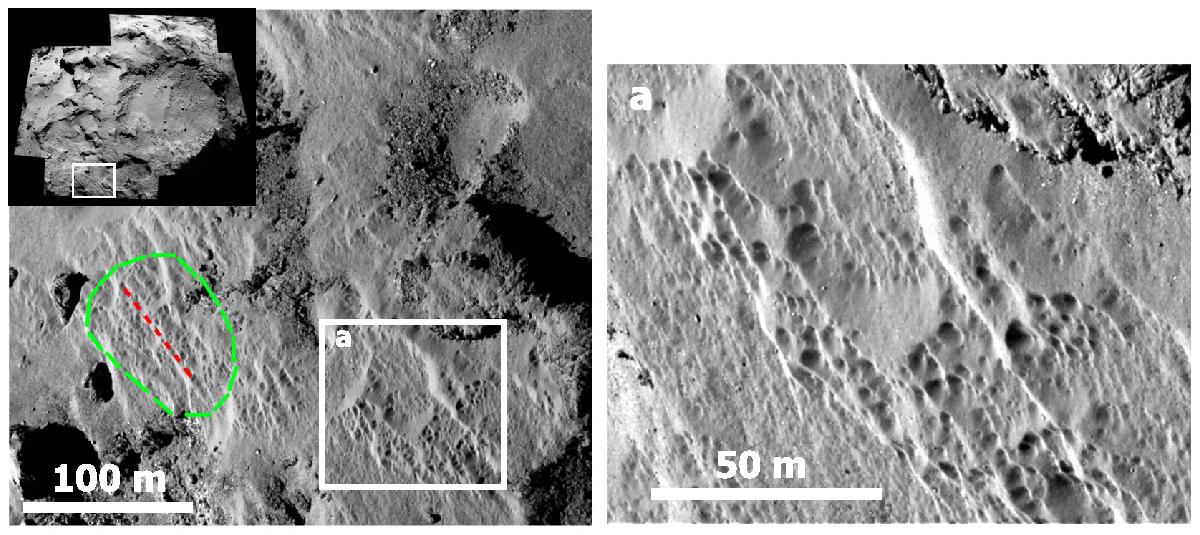
Examples of aligned pit-like features visible on smooth deposits in the Ma’at region. NAC images acquired on 2014-09-30 at 09:26:53 (left panel) and on 2014-10-19 at 12:22:15 (right panel) in orange filter. Enclosed by the green dashed line, we show the region for which the local horizon has been extracted, and the red dashed line denotes the considered orientation of the features for comparison with the solar orientation (see text for details).
Current usage metrics show cumulative count of Article Views (full-text article views including HTML views, PDF and ePub downloads, according to the available data) and Abstracts Views on Vision4Press platform.
Data correspond to usage on the plateform after 2015. The current usage metrics is available 48-96 hours after online publication and is updated daily on week days.
Initial download of the metrics may take a while.