Free Access
Fig. 23
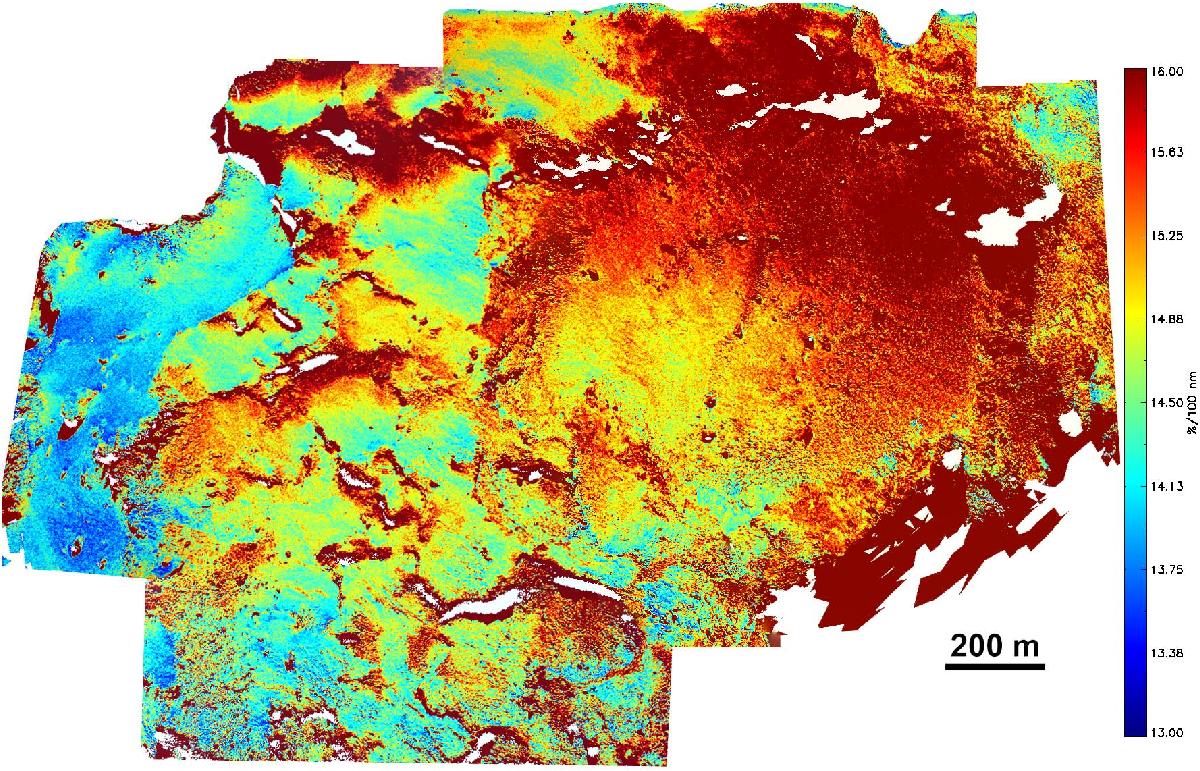
Composite spectral slope map computed with the formula in Eq. (9). Unobservable (e> 90°) and non-illuminated regions (i> 90°) are removed from the data and are represented in white in the map. Regions where near-IR/blue is lower than average are colored in blue, and regions where the ratio is higher than average are red.
Current usage metrics show cumulative count of Article Views (full-text article views including HTML views, PDF and ePub downloads, according to the available data) and Abstracts Views on Vision4Press platform.
Data correspond to usage on the plateform after 2015. The current usage metrics is available 48-96 hours after online publication and is updated daily on week days.
Initial download of the metrics may take a while.