Fig. 21
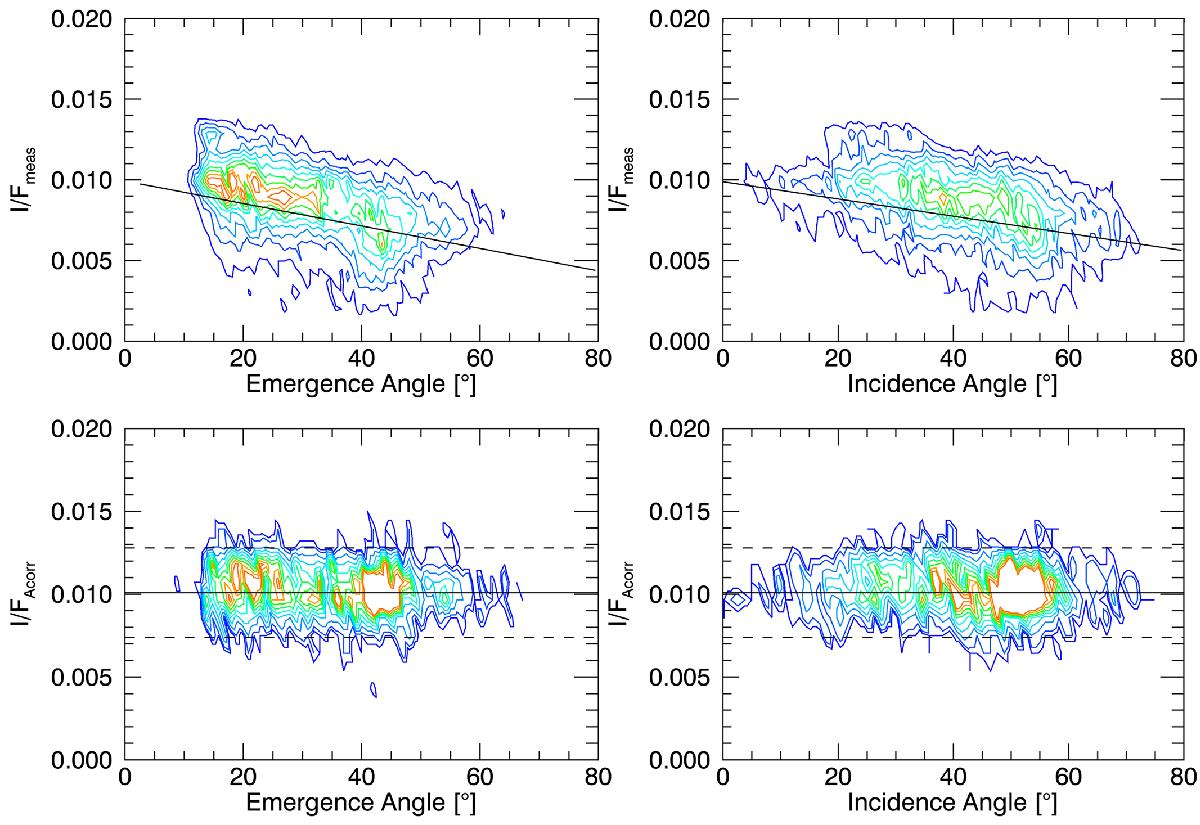
Evaluation of the photometric correction improvement. In the top panels the I/Fmeas of the NAC image in orange filter of set 4 in Table 1 is plotted as an example as a function of emergence (left) and incidence (right) angles in a density slice plot. I/Fmeas shows a linear dependence on both angles. The linear fit is overplotted. In the bottom panels the Akimov-photometrically corrected I/FAcorr of the same image is plotted as a function of the same angles. The scatter is reduced now to only the intrinsic reflectance variations, and the linear dependence is corrected, being I/FAcorr equally distributed at all incidence and emergence angles. The average value and ± σ scatter width is indicated by the solid and dashed lines, respectively. Colored contours indicate the density slices for values from 10 to 90 bins with intervals of 10. Angles bins are of 1° , while reflectance bins are of 0.001.
Current usage metrics show cumulative count of Article Views (full-text article views including HTML views, PDF and ePub downloads, according to the available data) and Abstracts Views on Vision4Press platform.
Data correspond to usage on the plateform after 2015. The current usage metrics is available 48-96 hours after online publication and is updated daily on week days.
Initial download of the metrics may take a while.