Fig. 9
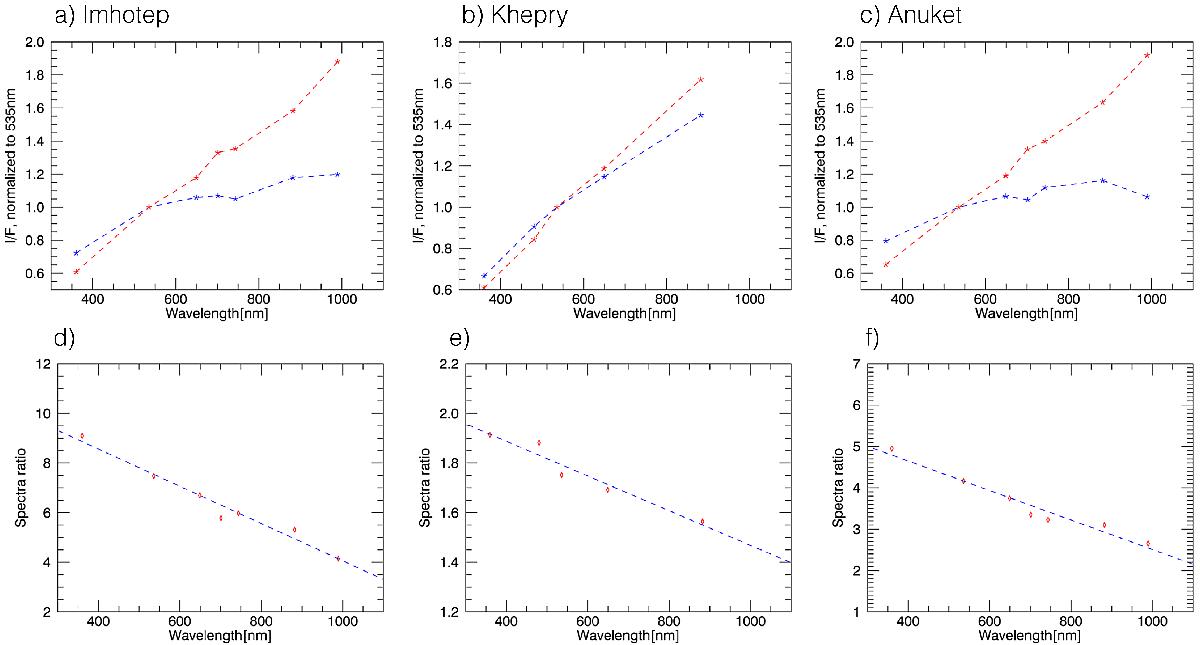
a), b), and c) average normalized reflectance spectra of three different bright features (blue) and dark terrain nearby (red) for the examples shown in Figs. 7e, c, and a, respectively. Spectra of the bright features were averaged over a region of interest (ROI) of a few pixels defined inside the bright feature, avoiding its edges that are often affected by imperfect coregistration at the pixel scale. Spectra of the dark soil were averaged in a similar way over regions defined by avoiding all visible shadows in the image. All spectra were then normalized by their value of reflectance at 535.7 nm. d), e), and f) corresponding ratios between the average spectra of the bright feature and the average spectra of the dark soil (crosses) and linear fit through these points (dashed lines).
Current usage metrics show cumulative count of Article Views (full-text article views including HTML views, PDF and ePub downloads, according to the available data) and Abstracts Views on Vision4Press platform.
Data correspond to usage on the plateform after 2015. The current usage metrics is available 48-96 hours after online publication and is updated daily on week days.
Initial download of the metrics may take a while.