Fig. 2
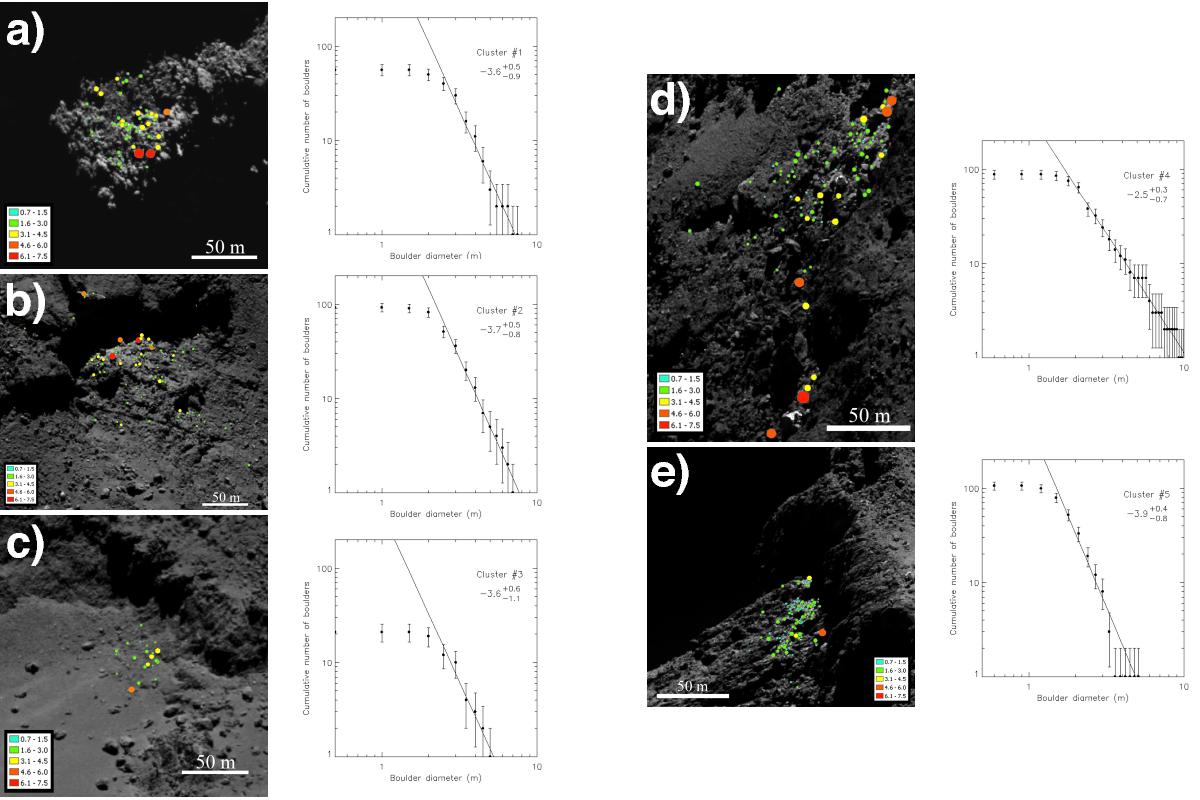
Cumulative size-frequency distributions for five clusters of bright features. Boulders with a dimension greater than one to two meters have been considered for these distributions, depending on the resolution of these images. The index of the power-law distribution fitted on the data is indicated in each plot.
Current usage metrics show cumulative count of Article Views (full-text article views including HTML views, PDF and ePub downloads, according to the available data) and Abstracts Views on Vision4Press platform.
Data correspond to usage on the plateform after 2015. The current usage metrics is available 48-96 hours after online publication and is updated daily on week days.
Initial download of the metrics may take a while.