Fig. 11
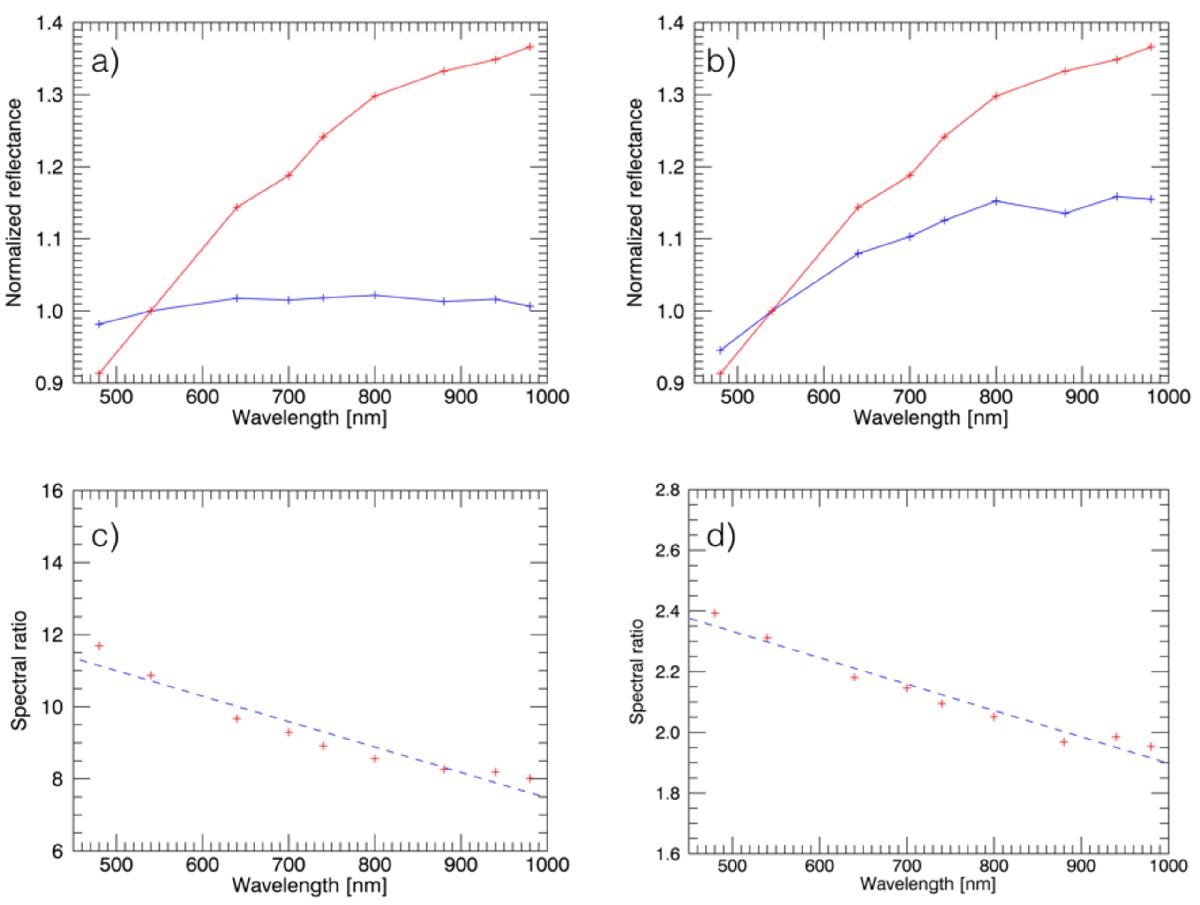
a) and b) normalized reflectance spectra corresponding to different steps of a sublimation experiment using μm-sized H2O ice mixed with 5 wt.% basaltic airfall ash and 1 wt.% nanoparticle carbon as initial material. The red spectra in plots a) and b) are those of the final material at the end of the sublimation experiment. The blue spectrum in plot a) was acquired at the very beginning of the sublimation. The blue spectrum in plot b) was acquired about 10 h later. All spectra were normalized to their value of reflectance at 535.7 nm. c) and d) corresponding spectral ratios between the blue curves and red curves in plots a) and b), respectively (crosses) and linear fit through these points (dashed lines).
Current usage metrics show cumulative count of Article Views (full-text article views including HTML views, PDF and ePub downloads, according to the available data) and Abstracts Views on Vision4Press platform.
Data correspond to usage on the plateform after 2015. The current usage metrics is available 48-96 hours after online publication and is updated daily on week days.
Initial download of the metrics may take a while.