Fig. 17
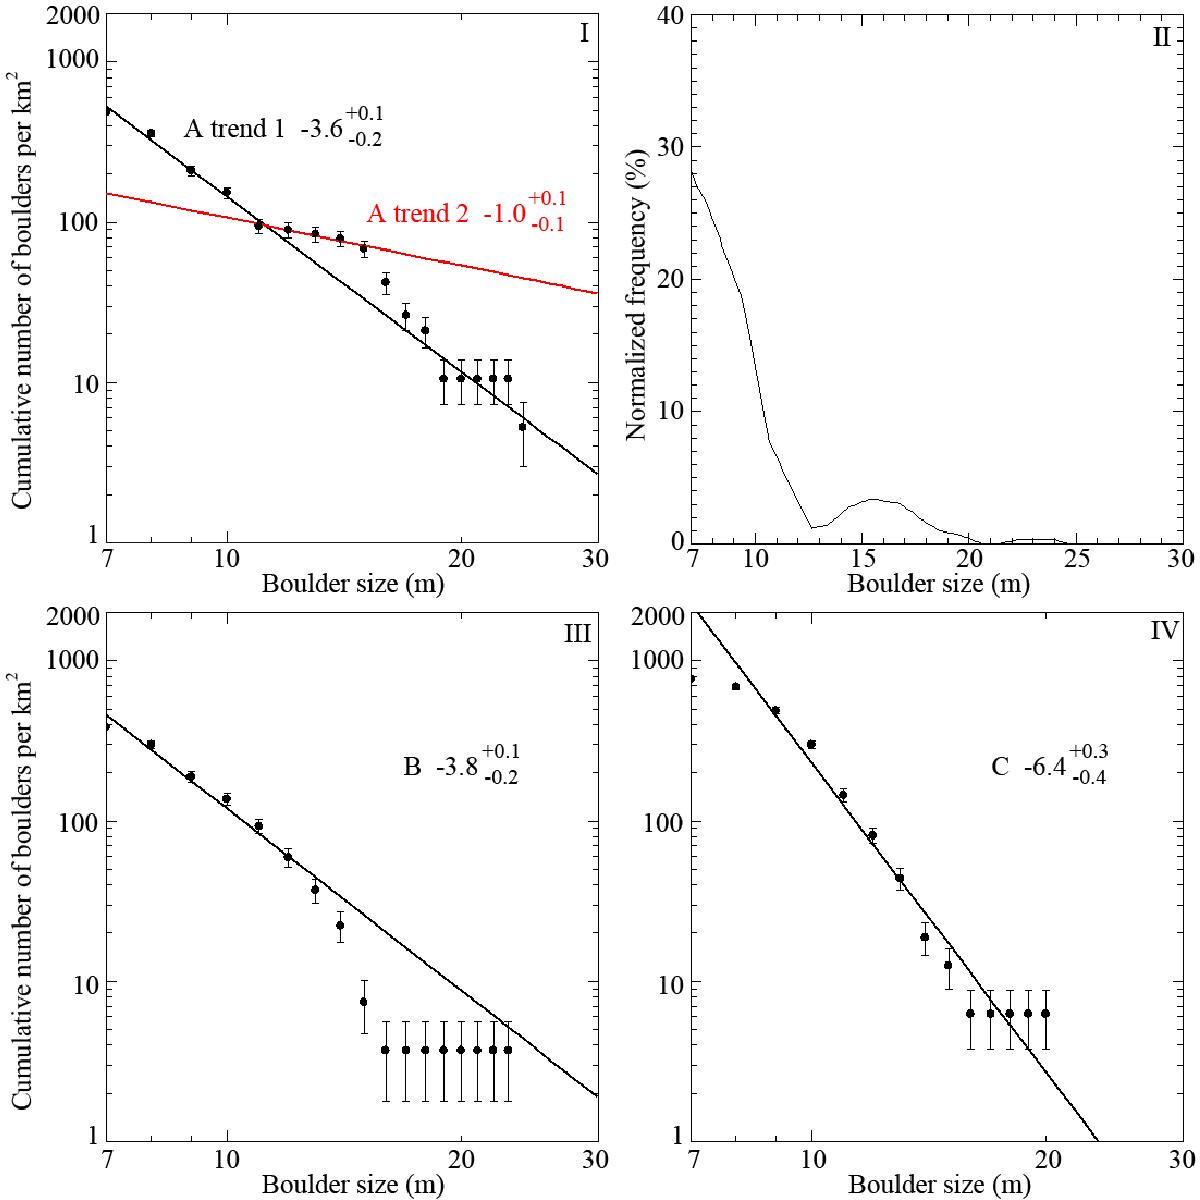
Size-frequency distribution per km2 of area A presented in Fig. 16. II) The continuous frequency percentage of the boulder sizes for area A, evaluated as the derivative of the cumulative distribution of the boulders cleaned with a low-pass filter and normalized to the total amount of the boulders considered. III) and IV) size-frequency distributions per km2 for areas B and C.
Current usage metrics show cumulative count of Article Views (full-text article views including HTML views, PDF and ePub downloads, according to the available data) and Abstracts Views on Vision4Press platform.
Data correspond to usage on the plateform after 2015. The current usage metrics is available 48-96 hours after online publication and is updated daily on week days.
Initial download of the metrics may take a while.