Free Access
Fig. 6
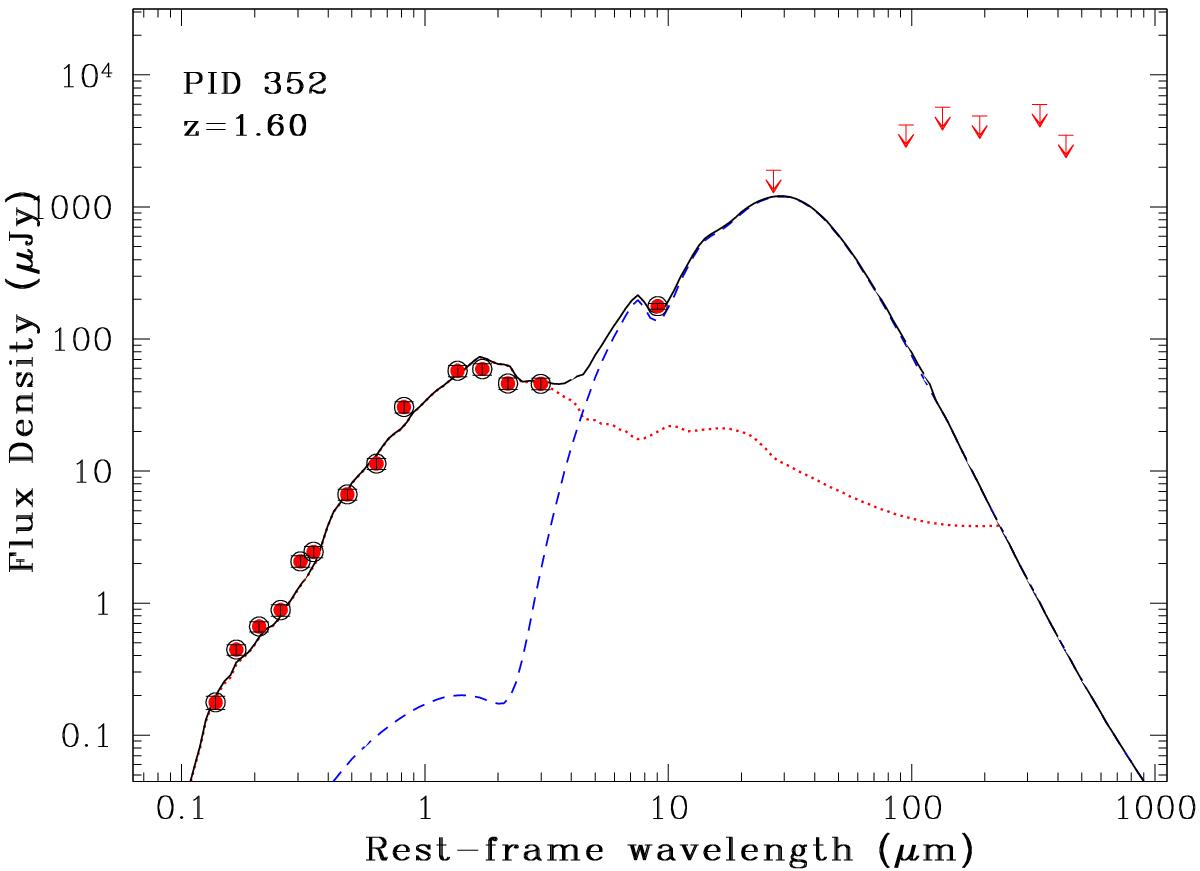
Restframe spectral energy distribution for PID352. Available datapoints and upper limits (5σ) are plotted as red filled circles and downward-pointing arrows, respectively. The solid black line is the summed contribution of the AGN (blue dashed) and galaxy (red dotted) components. A redshift of z = 1.6 has been assumed.
Current usage metrics show cumulative count of Article Views (full-text article views including HTML views, PDF and ePub downloads, according to the available data) and Abstracts Views on Vision4Press platform.
Data correspond to usage on the plateform after 2015. The current usage metrics is available 48-96 hours after online publication and is updated daily on week days.
Initial download of the metrics may take a while.