Fig. 4
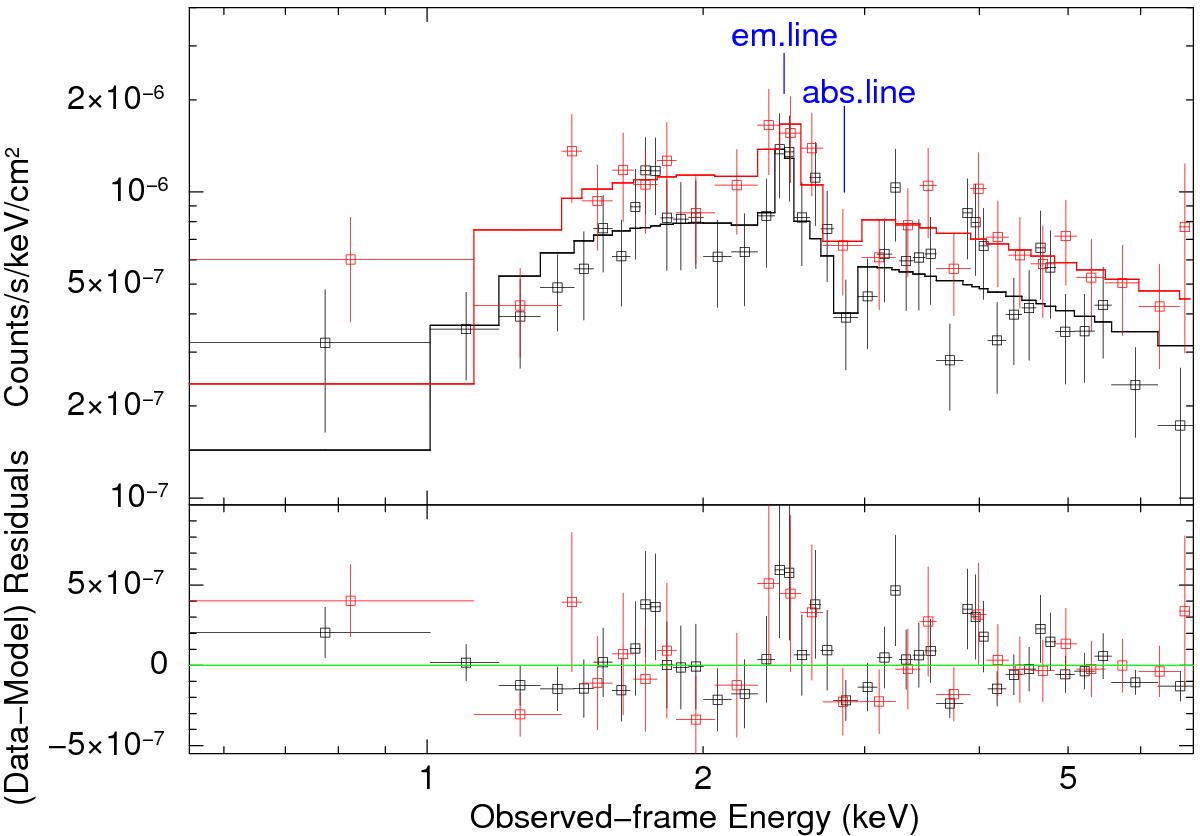
Top panel: Chandra CDF-S and E-CDF-S spectra of PID352, normalized by the effective area and fitted with an absorbed powerlaw, plus one emission line and one absorption line. The red datapoints refer to the E-CDF-S data, and the black ones to the higher statistics CDF-S data. The best-fitting model is shown as continuous curves. The observed-frame energy of the emission and absorption lines are also shown. All of the data have been rebinned to the 3σ level for presentation purposes. Bottom panel: data − model residuals once both datasets are fitted with an absorbed powerlaw without including any feature.
Current usage metrics show cumulative count of Article Views (full-text article views including HTML views, PDF and ePub downloads, according to the available data) and Abstracts Views on Vision4Press platform.
Data correspond to usage on the plateform after 2015. The current usage metrics is available 48-96 hours after online publication and is updated daily on week days.
Initial download of the metrics may take a while.