Fig. 3
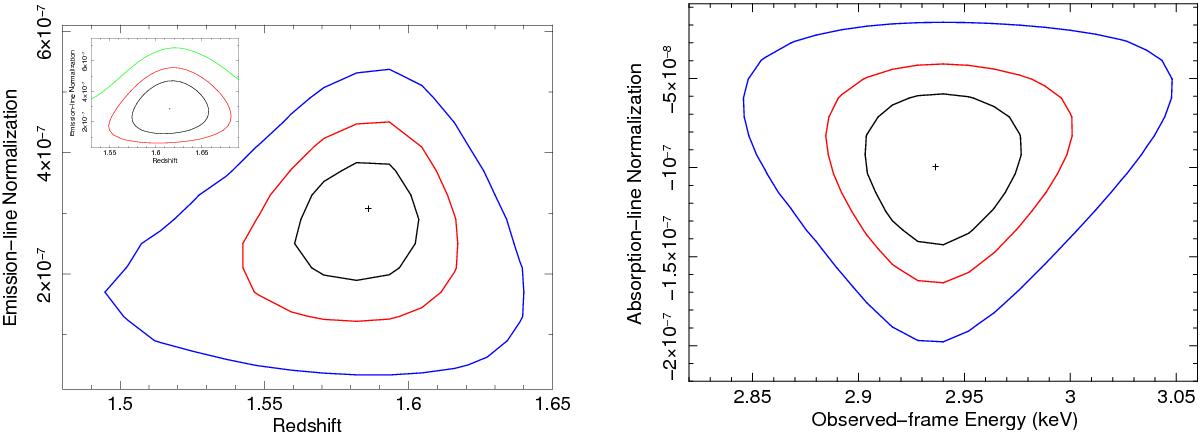
XMM-Newton spectral results: (left panel) redshift vs. FeKα line normalization. For comparison, the redshift estimate obtained by Chandra data is shown in the inset; (right panel) observed-frame absorption-line energy vs. normalization. In all panels, contours represent the 68, 90, and 99% confidence levels for two parameters of interest.
Current usage metrics show cumulative count of Article Views (full-text article views including HTML views, PDF and ePub downloads, according to the available data) and Abstracts Views on Vision4Press platform.
Data correspond to usage on the plateform after 2015. The current usage metrics is available 48-96 hours after online publication and is updated daily on week days.
Initial download of the metrics may take a while.