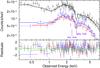
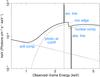
Fig. 2
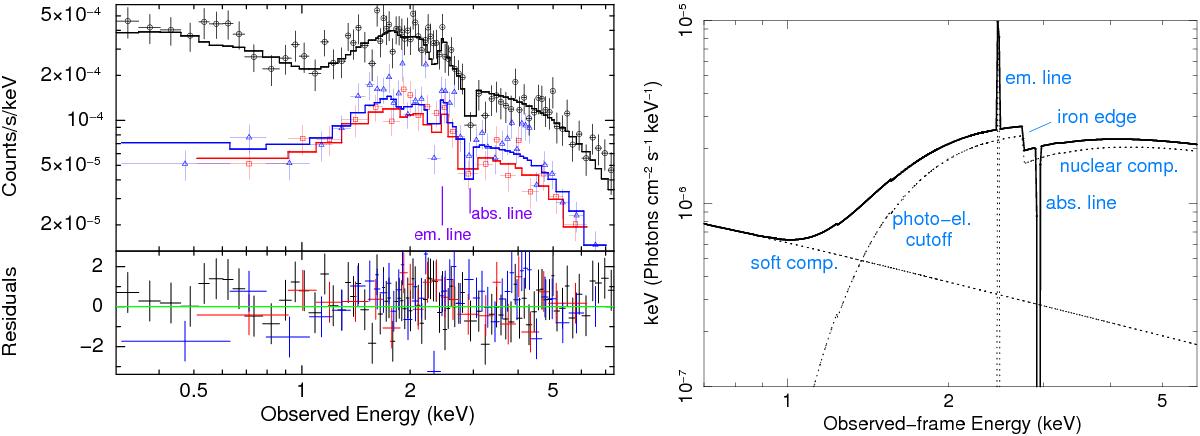
Left panel: XMM-Newton spectrum of PID352 fitted with a double powerlaw (one absorbed) plus one emission line and one absorption line. The black/blue/red lines and datapoints refer to pn/MOS1/MOS2 data. Emission and absorption lines are both marked. In the bottom panel, the data-to-model residuals are shown in units of σ. Right panel: best-fitting XMM-Newton model (thick solid line), with indications of the spectral components (dotted lines). In particular, we note that the iron edge is at a different energy with respect to that of the absorption feature.
Current usage metrics show cumulative count of Article Views (full-text article views including HTML views, PDF and ePub downloads, according to the available data) and Abstracts Views on Vision4Press platform.
Data correspond to usage on the plateform after 2015. The current usage metrics is available 48-96 hours after online publication and is updated daily on week days.
Initial download of the metrics may take a while.