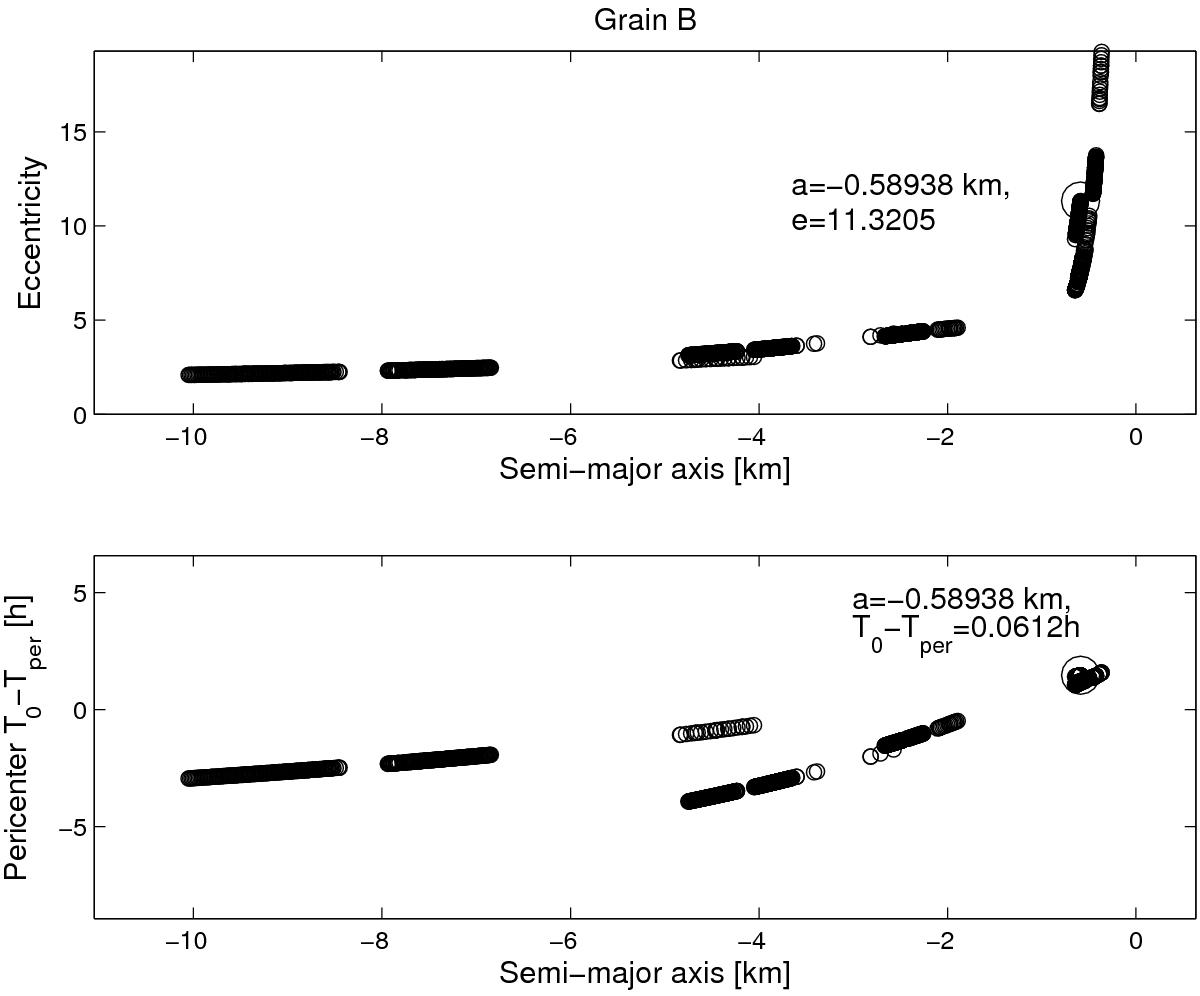
Fig. 5

Upper panel: eccentricity e of grain B versus semi-major axis a. Lower panel: the time T0−Tper that has passed since the pericenter crossing Tper until the epoch T0 = 2 456 910.6667 JD, versus a. The values of e and T0−Tper corresponding to the lowest value of the maximum residual are highlighted.
Current usage metrics show cumulative count of Article Views (full-text article views including HTML views, PDF and ePub downloads, according to the available data) and Abstracts Views on Vision4Press platform.
Data correspond to usage on the plateform after 2015. The current usage metrics is available 48-96 hours after online publication and is updated daily on week days.
Initial download of the metrics may take a while.


