Fig. 8
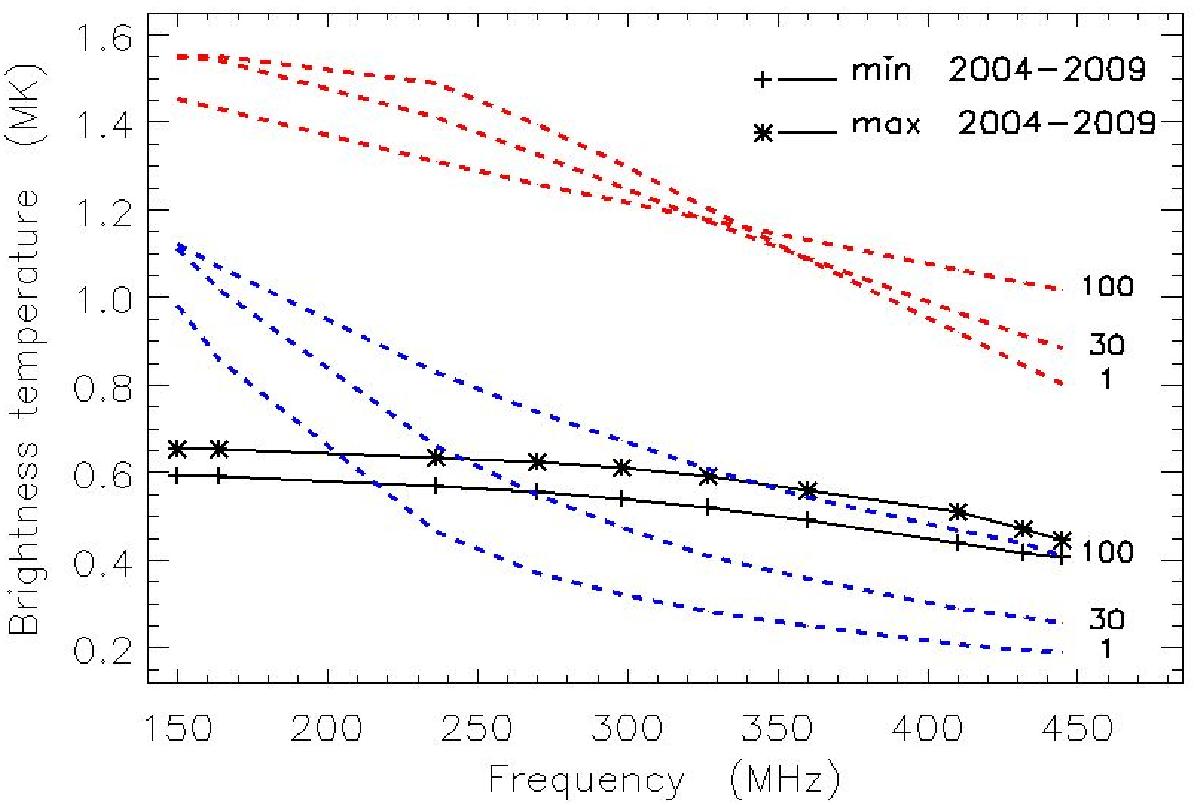
Comparison between the range of the observed spectra on the disk (between black curves) and the predicted spectra (blue and red curves), assuming that Te = TH = 1550 kK elsewhere in the corona. Theoretical curves are labeled with the thickness h2 of the upper part of the TR (Mm). Red curves refer to 2004 (near cycle maximum) and blue ones to cycle minimum (2008–2009).
Current usage metrics show cumulative count of Article Views (full-text article views including HTML views, PDF and ePub downloads, according to the available data) and Abstracts Views on Vision4Press platform.
Data correspond to usage on the plateform after 2015. The current usage metrics is available 48-96 hours after online publication and is updated daily on week days.
Initial download of the metrics may take a while.