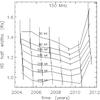
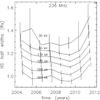
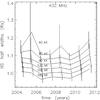
Fig. 4
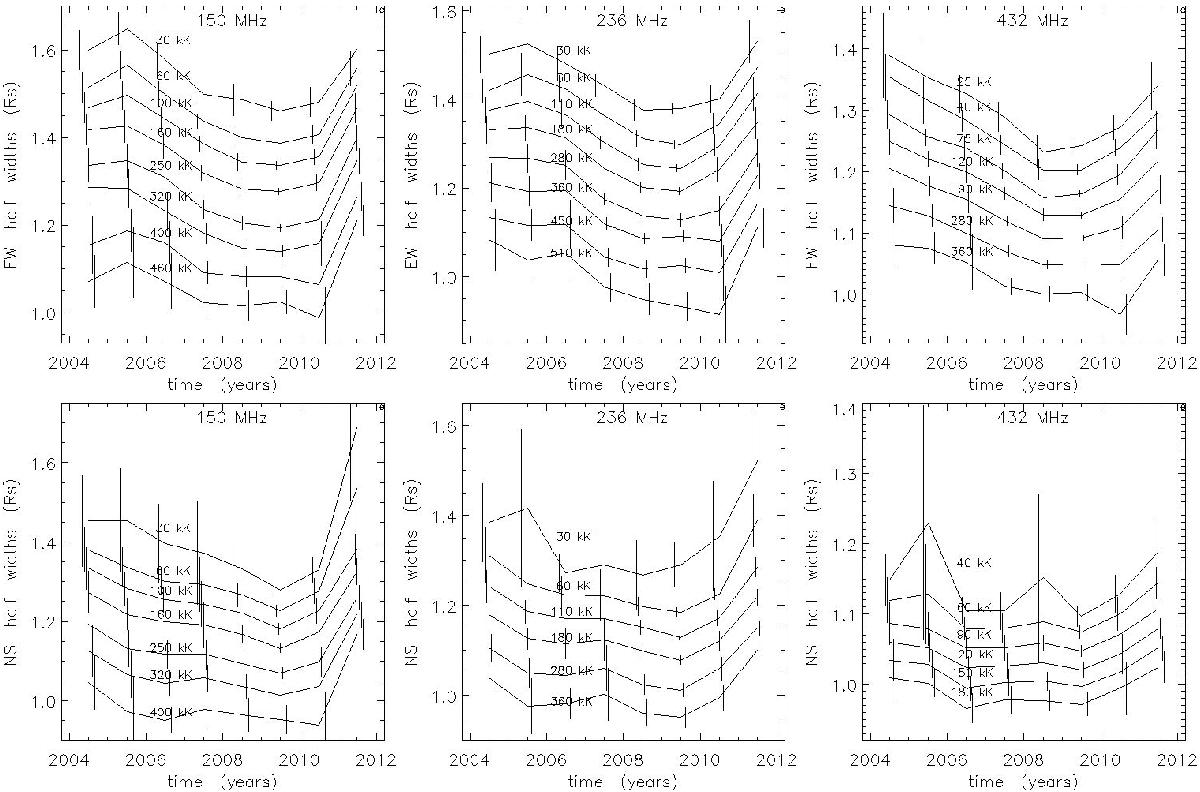
Apparent widths of the Sun at several levels in EW (top) and NS (bottom) directions for three radio frequencies (150 MHz at left, 236 MHz at middle, 432 MHz at right), between 2004 and 2011. The curves, labeled with the brightness temperature Tb (kK), give yearly-averaged values. The vertical bars give the rms dispersions for each year. They are slightly shifted relative to each other in order not to overlap.
Current usage metrics show cumulative count of Article Views (full-text article views including HTML views, PDF and ePub downloads, according to the available data) and Abstracts Views on Vision4Press platform.
Data correspond to usage on the plateform after 2015. The current usage metrics is available 48-96 hours after online publication and is updated daily on week days.
Initial download of the metrics may take a while.