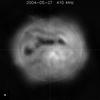
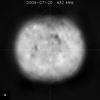
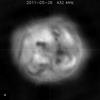
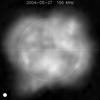
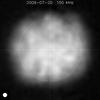
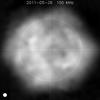
Fig. 3

Examples of images of the Sun. From top to bottom and from left to right: i) during decay of cycle on May 27, 2004, at 410 and 150 MHz; ii) during cycle minimum on July 20, 2009 at 432 and 150 MHz; and iii) during growth of cycle on May 26, 2011 at 432 and 150 MHz. For each day, we note the differences between the aspects of the Sun in high and in low frequencies. The frame widths are 3.2 R⊙. Resolutions are given at lower left corner. The light circle is the optical limb.
Current usage metrics show cumulative count of Article Views (full-text article views including HTML views, PDF and ePub downloads, according to the available data) and Abstracts Views on Vision4Press platform.
Data correspond to usage on the plateform after 2015. The current usage metrics is available 48-96 hours after online publication and is updated daily on week days.
Initial download of the metrics may take a while.