Fig. 12
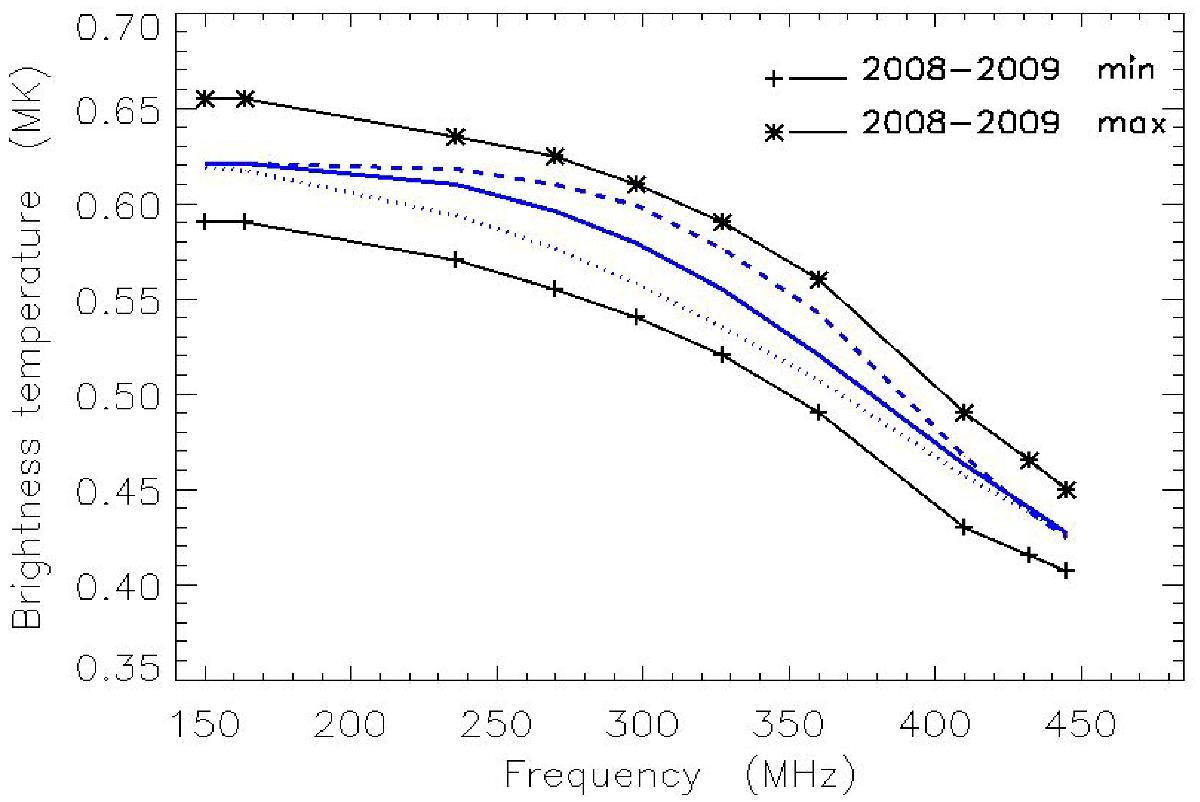
Comparison between the range of the observed spectra on the disk for 2008–2009 (between black curves) and the predicted spectra, assuming two coronal layers with TH = 615 kK and 1.5 MK, and with Te = 615 kK elsewhere in the corona (blue curves). The continuous line corresponds to h3 = 20 Mm and h2 = 10 Mm, the dotted line to h3 = 10 Mm and h2 = 28 Mm and Mm, and dashed line to h3 = 28 Mm and h2 = 1.7 Mm.
Current usage metrics show cumulative count of Article Views (full-text article views including HTML views, PDF and ePub downloads, according to the available data) and Abstracts Views on Vision4Press platform.
Data correspond to usage on the plateform after 2015. The current usage metrics is available 48-96 hours after online publication and is updated daily on week days.
Initial download of the metrics may take a while.