Fig. 2
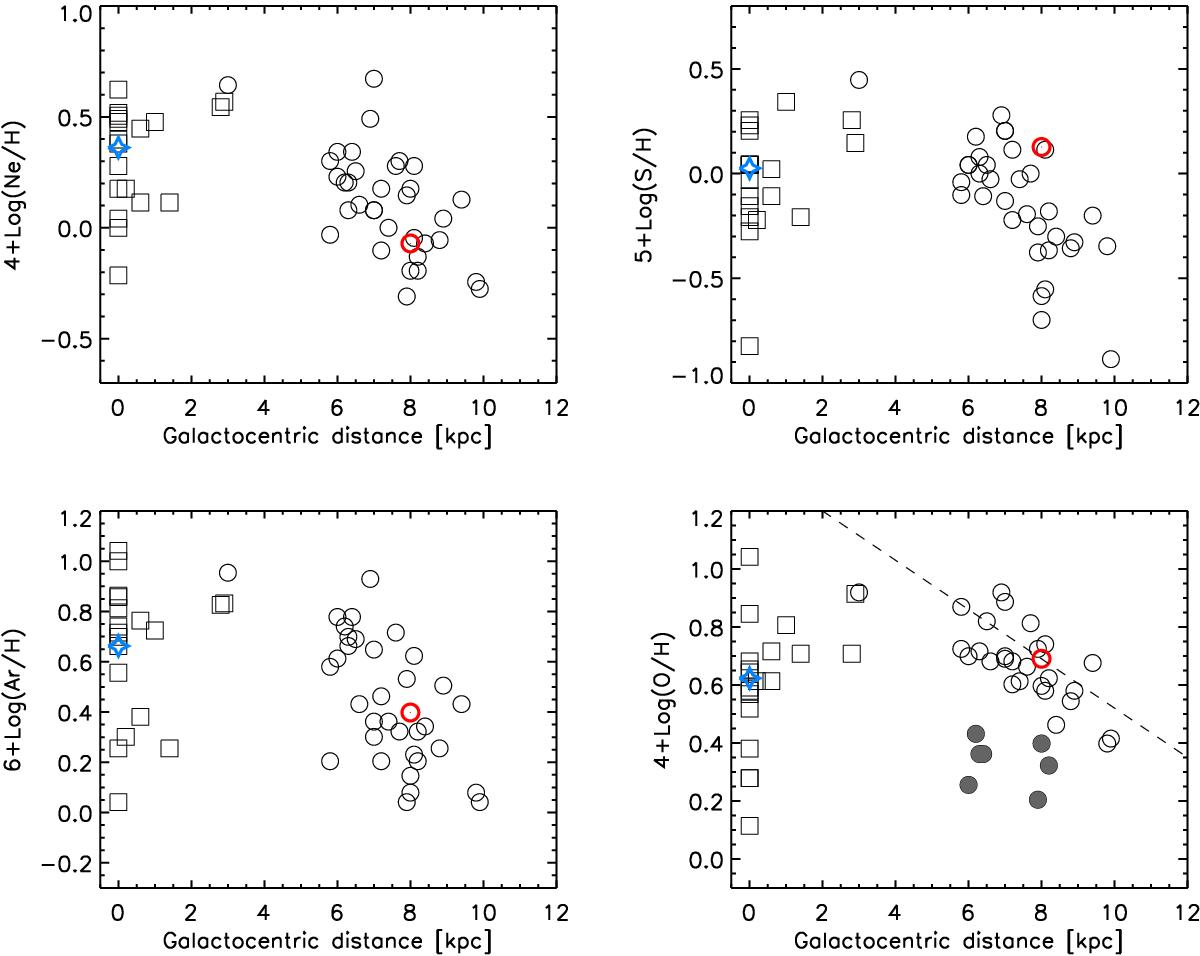
Abundances of Ne, S, Ar, and O as a function of distance from the Galactic centre. The bulge PNe (squares) do not have known distances but those with high velocity are all between 0 and 3 kpc from the centre. For some of these PNe the distance listed by Gutenkunst et al. (2008) is used to avoid crowding of the points. The red and blue symbols indicate the solar abundances and the average bulge abundances respectively. The filled circles in the oxygen diagram indicate those PNe where oxygen burning is thought to have taken place.
Current usage metrics show cumulative count of Article Views (full-text article views including HTML views, PDF and ePub downloads, according to the available data) and Abstracts Views on Vision4Press platform.
Data correspond to usage on the plateform after 2015. The current usage metrics is available 48-96 hours after online publication and is updated daily on week days.
Initial download of the metrics may take a while.