Free Access
Fig. 1
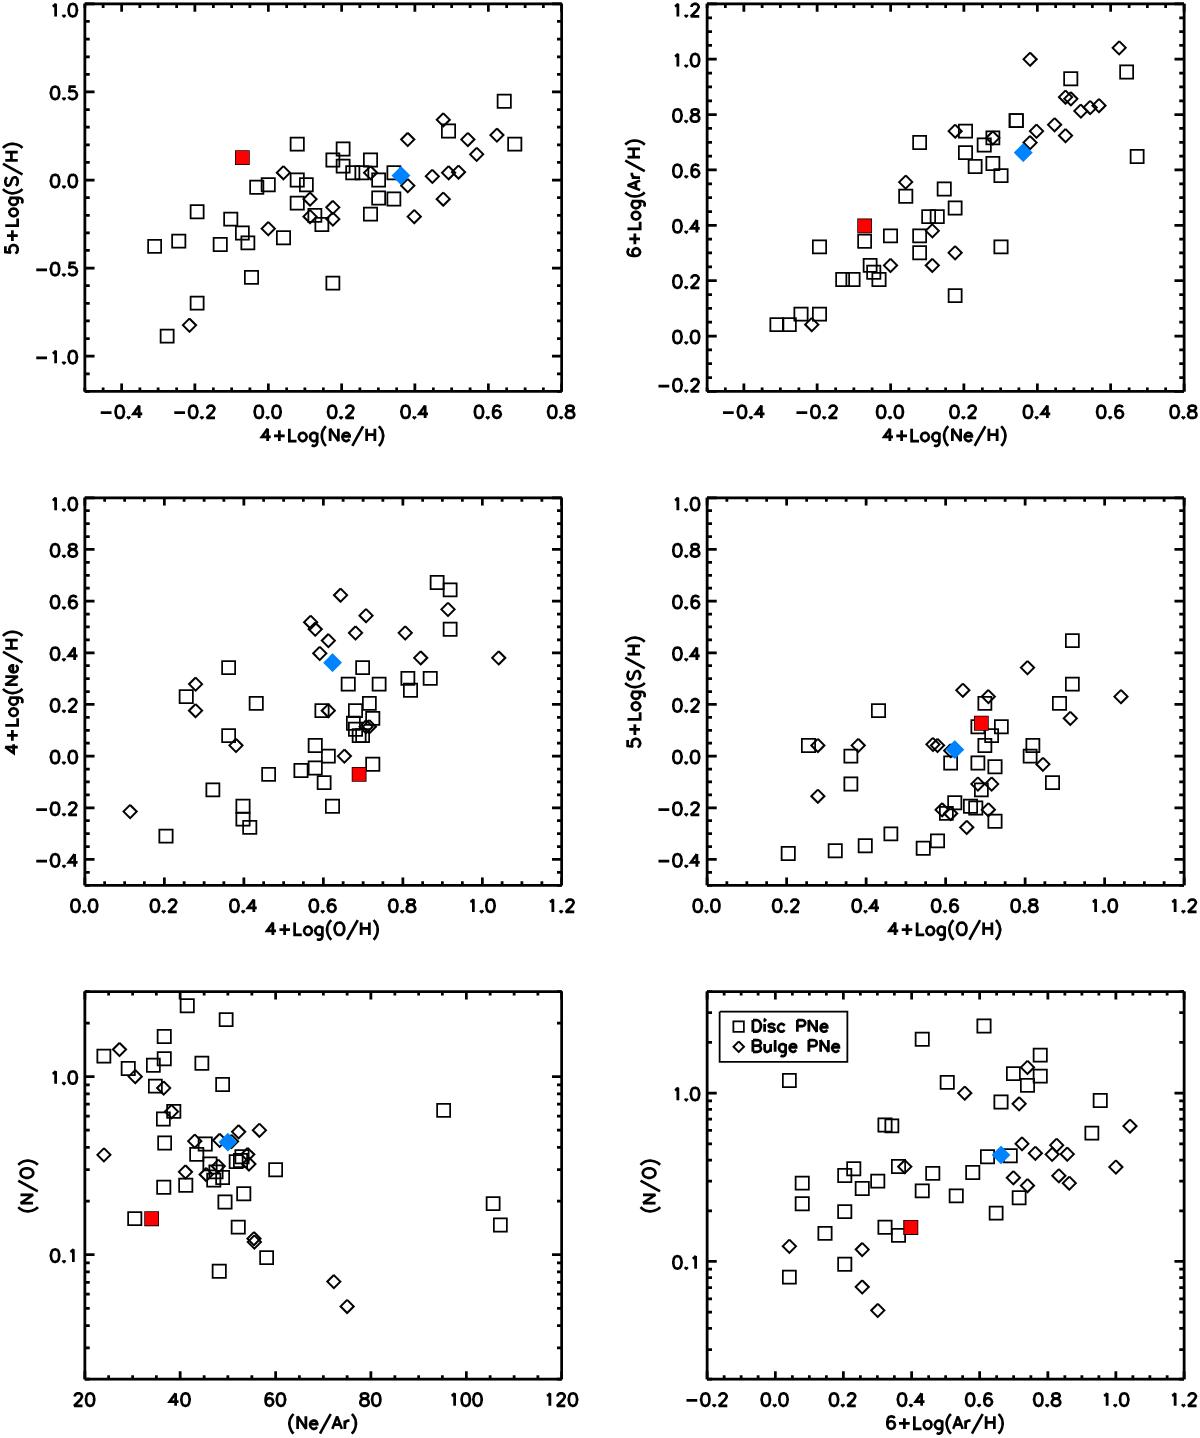
Abundances of Ne, S, Ar and O plotted against one another. The bulge PNe are plotted as small squares and the disc PNe as large squares. The red and blue symbols indicate the solar abundances and the average bulge abundances respectively.
Current usage metrics show cumulative count of Article Views (full-text article views including HTML views, PDF and ePub downloads, according to the available data) and Abstracts Views on Vision4Press platform.
Data correspond to usage on the plateform after 2015. The current usage metrics is available 48-96 hours after online publication and is updated daily on week days.
Initial download of the metrics may take a while.