Fig. 8
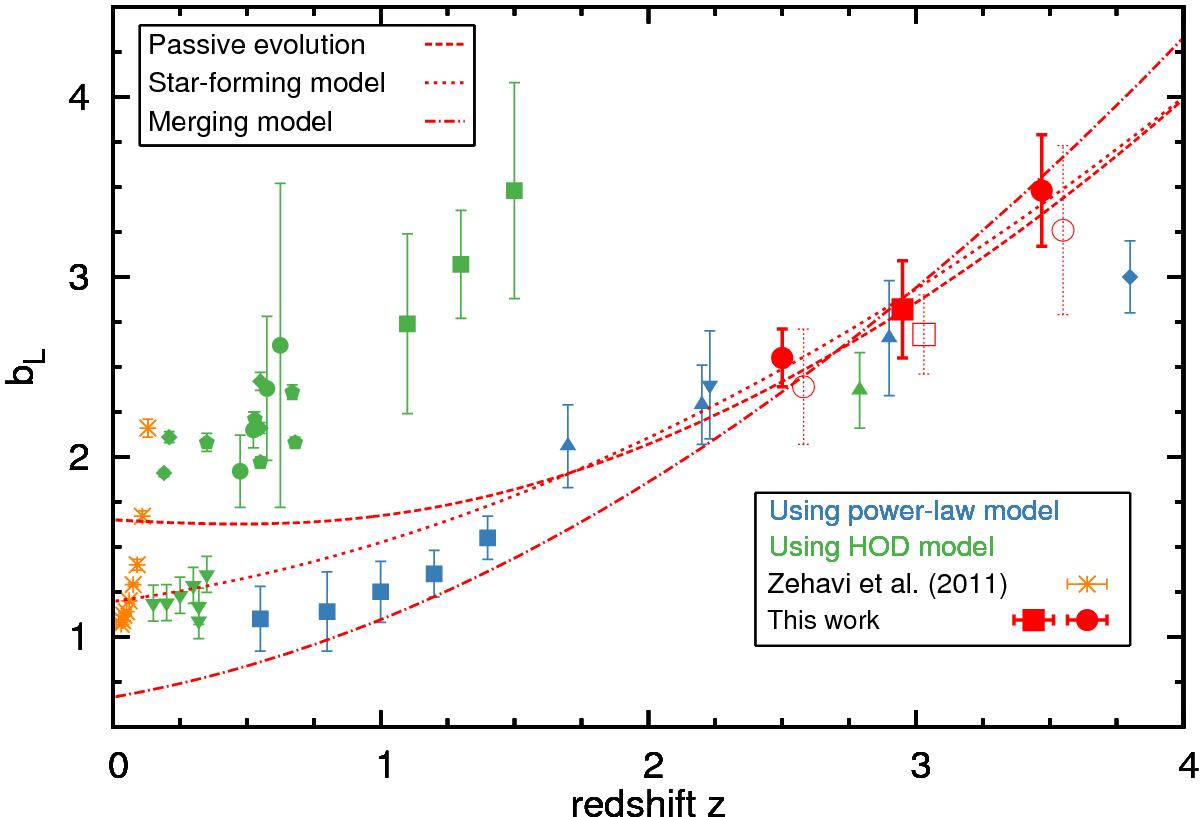
Large-scale linear galaxy bias retrieved by using two methods. Red filled square indicate measurements of ![]() for the wide range redshift sample, while the red filled circles for the low and high redshift samples. The open red square and circles represent
for the wide range redshift sample, while the red filled circles for the low and high redshift samples. The open red square and circles represent ![]() in three redshift ranges respectivley. Green and blue point represents the results from previous works, retrieved by using HOD (green circles – Blake et al. 2008; green diamonds – Wake et al. 2008; green reversed triangles – Ross & Brunner 2009; green polygons – Sawangwit et al. 2011; green squares – Kim et al. 2014; green triangles – Bielby et al. 2013) and power-law frameworks (blue squares – Marinoni et al. 2005; blue triangles – Adelberger et al. 2005; blue reversed triangles – Geach et al. 2012; blue diamonds – Barone-Nugent et al. 2014) We show 3 different models for the evolution of bias: a passive evolution model (red dashed line) a merging model (red dot-dashed line), a star-forming model (dotted line), as described in the Sect. 5.3.
in three redshift ranges respectivley. Green and blue point represents the results from previous works, retrieved by using HOD (green circles – Blake et al. 2008; green diamonds – Wake et al. 2008; green reversed triangles – Ross & Brunner 2009; green polygons – Sawangwit et al. 2011; green squares – Kim et al. 2014; green triangles – Bielby et al. 2013) and power-law frameworks (blue squares – Marinoni et al. 2005; blue triangles – Adelberger et al. 2005; blue reversed triangles – Geach et al. 2012; blue diamonds – Barone-Nugent et al. 2014) We show 3 different models for the evolution of bias: a passive evolution model (red dashed line) a merging model (red dot-dashed line), a star-forming model (dotted line), as described in the Sect. 5.3.
Current usage metrics show cumulative count of Article Views (full-text article views including HTML views, PDF and ePub downloads, according to the available data) and Abstracts Views on Vision4Press platform.
Data correspond to usage on the plateform after 2015. The current usage metrics is available 48-96 hours after online publication and is updated daily on week days.
Initial download of the metrics may take a while.