Fig. 7
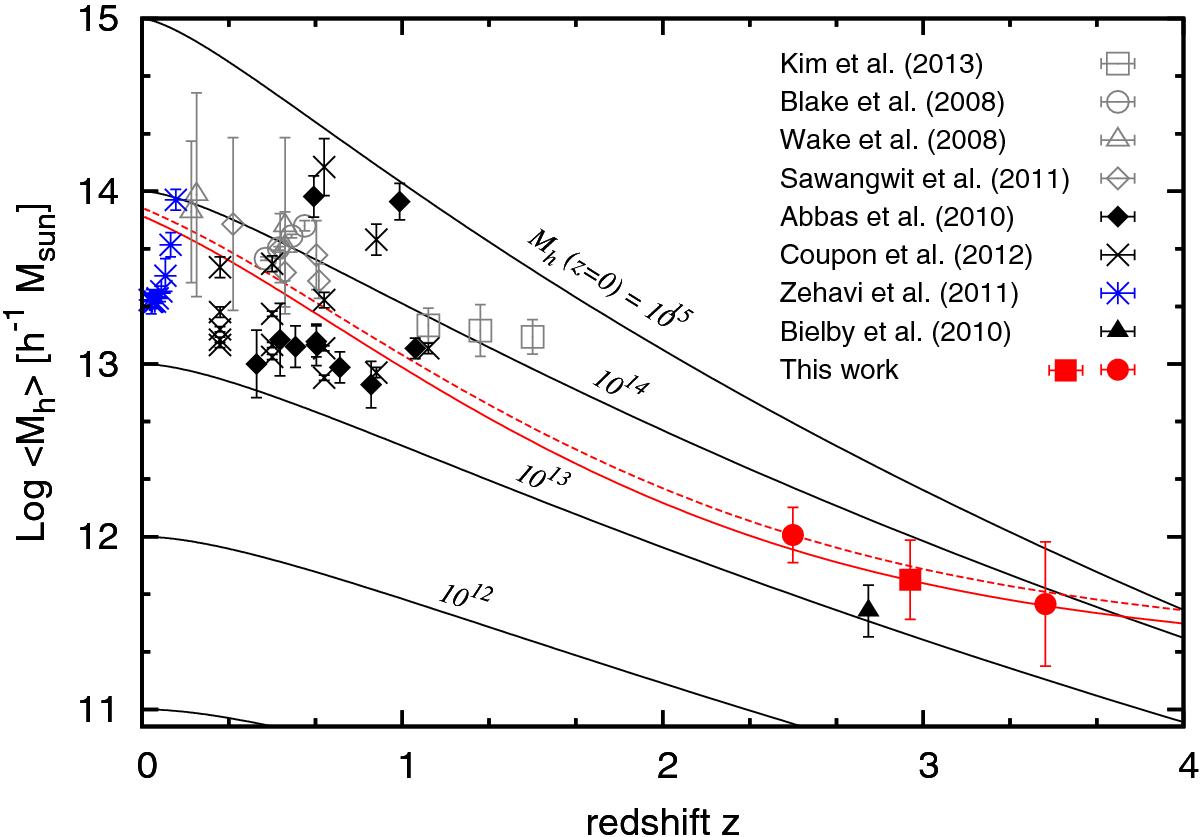
Evolution of the number-weighted average host halo mass given by Eq. (10) for the three redshift ranges analysed in this study. The red filled square indicate mass estimations from VUDS for the wide range redshift sample, while red filled circles for low and high redshift ones. Black and grey symbols represent the results of previous work based on spectroscopic and photometric surveys respectively. The solid black lines indicate how a host halo of a given mass M0 at z = 0 evolves with redshift, according to the model given by van den Bosch (2002). The solid red line represents the halo mass evolution derived using Eq. (21), with the HOD parameters obtained from the best-fit HOD model at a redshift z ~ 3. The dashed red line is using the HOD best-fit parameters for z ~ 2.5. VUDS galaxies with a typical L⋆ luminosity are likely to evolve into galaxies with a luminosity >L⋆ today.
Current usage metrics show cumulative count of Article Views (full-text article views including HTML views, PDF and ePub downloads, according to the available data) and Abstracts Views on Vision4Press platform.
Data correspond to usage on the plateform after 2015. The current usage metrics is available 48-96 hours after online publication and is updated daily on week days.
Initial download of the metrics may take a while.