Fig. 6
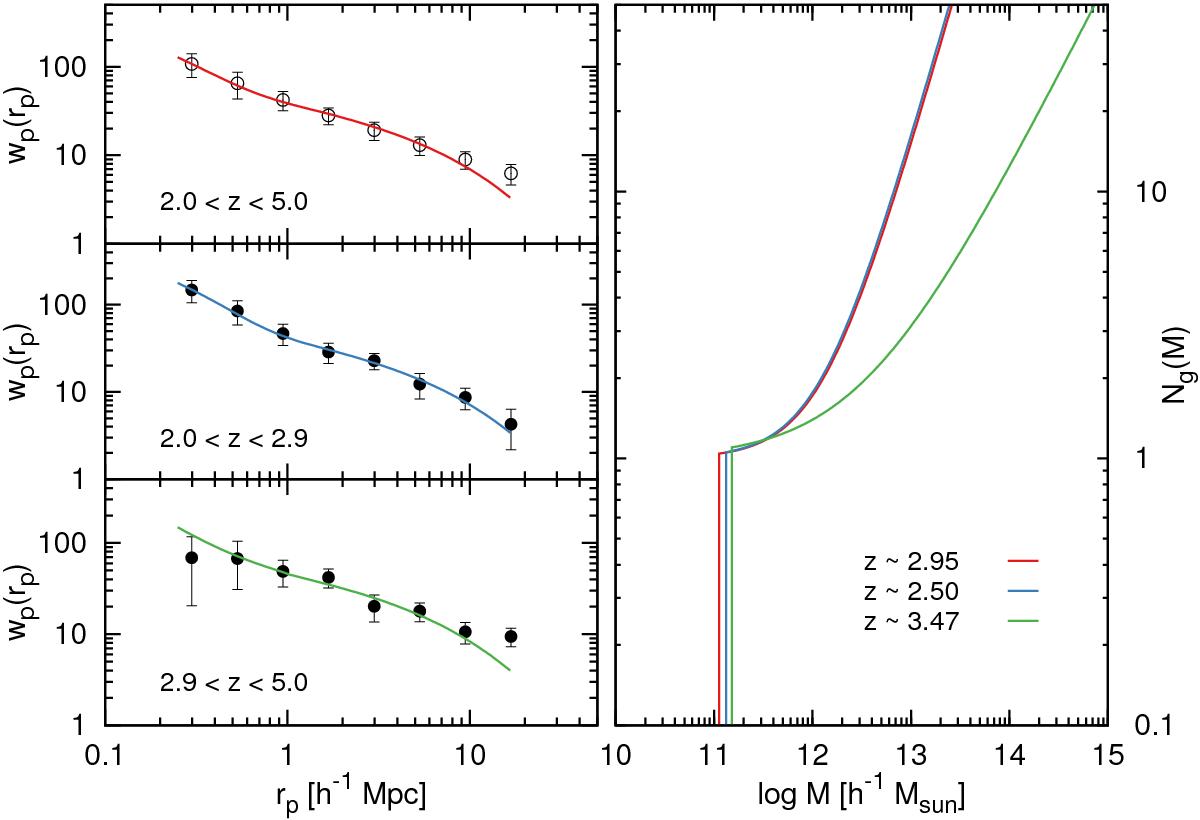
Left panels: correlation function for three redshift subsamples as in Fig. 4. Top panel represents measurements for a wide redshift range 2 <z < 5 sample, while lower panels present correlation function measurements for two independent low and high redshift galaxy samples. The solid lines present the best-fit halo occupation model. Right panel: the evolution of the halo occupation for the three redshift ranges.
Current usage metrics show cumulative count of Article Views (full-text article views including HTML views, PDF and ePub downloads, according to the available data) and Abstracts Views on Vision4Press platform.
Data correspond to usage on the plateform after 2015. The current usage metrics is available 48-96 hours after online publication and is updated daily on week days.
Initial download of the metrics may take a while.