Fig. 4
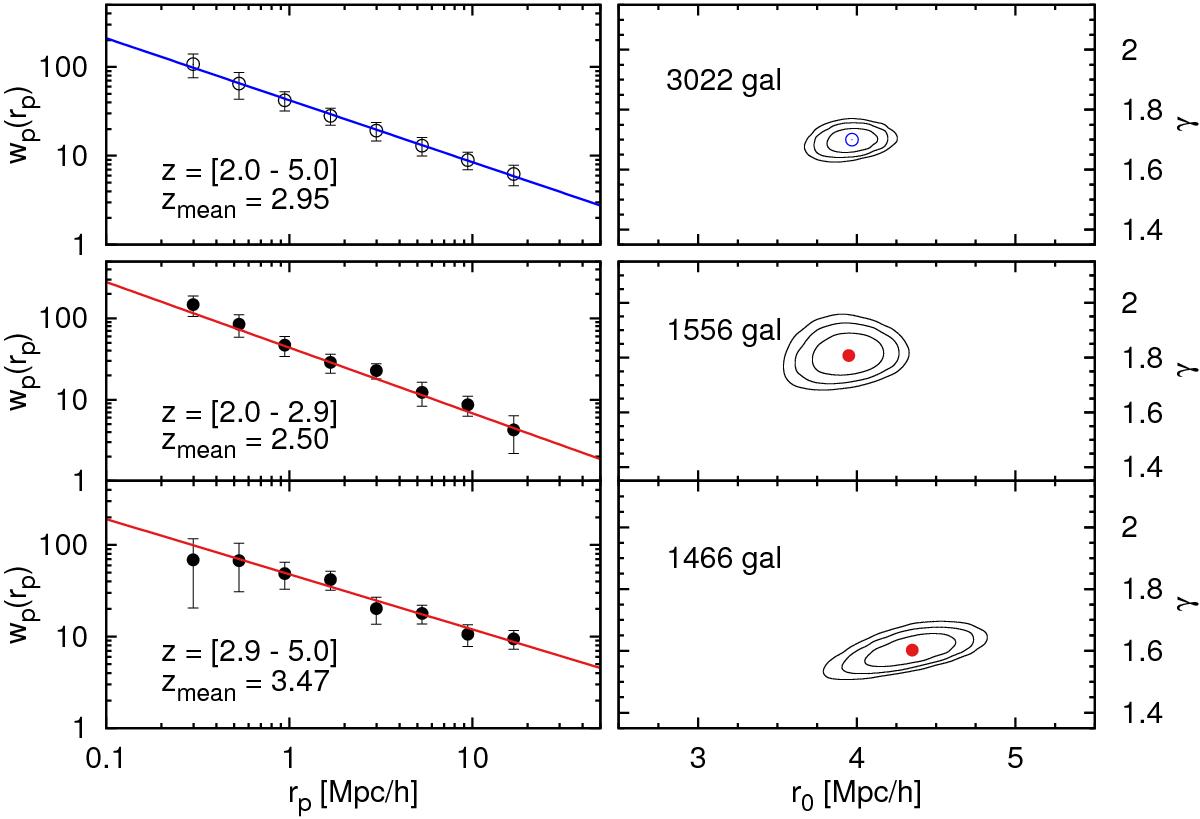
Left panel: projected two-point correlation function wp(rp). The symbols and error bars denote measurements of the composite correlation function from the VUDS survey. Right panel: associated best-fit power-law parameters r0 and γ along with error contours for the general galaxy population separated in three redshift ranges. Top panels present a measurement for a wide redshift range 2 < z < 5 sample, while lower panels present the correlation function measurements for two independent low and high redshift galaxy samples.
Current usage metrics show cumulative count of Article Views (full-text article views including HTML views, PDF and ePub downloads, according to the available data) and Abstracts Views on Vision4Press platform.
Data correspond to usage on the plateform after 2015. The current usage metrics is available 48-96 hours after online publication and is updated daily on week days.
Initial download of the metrics may take a while.