Free Access
Fig. 3
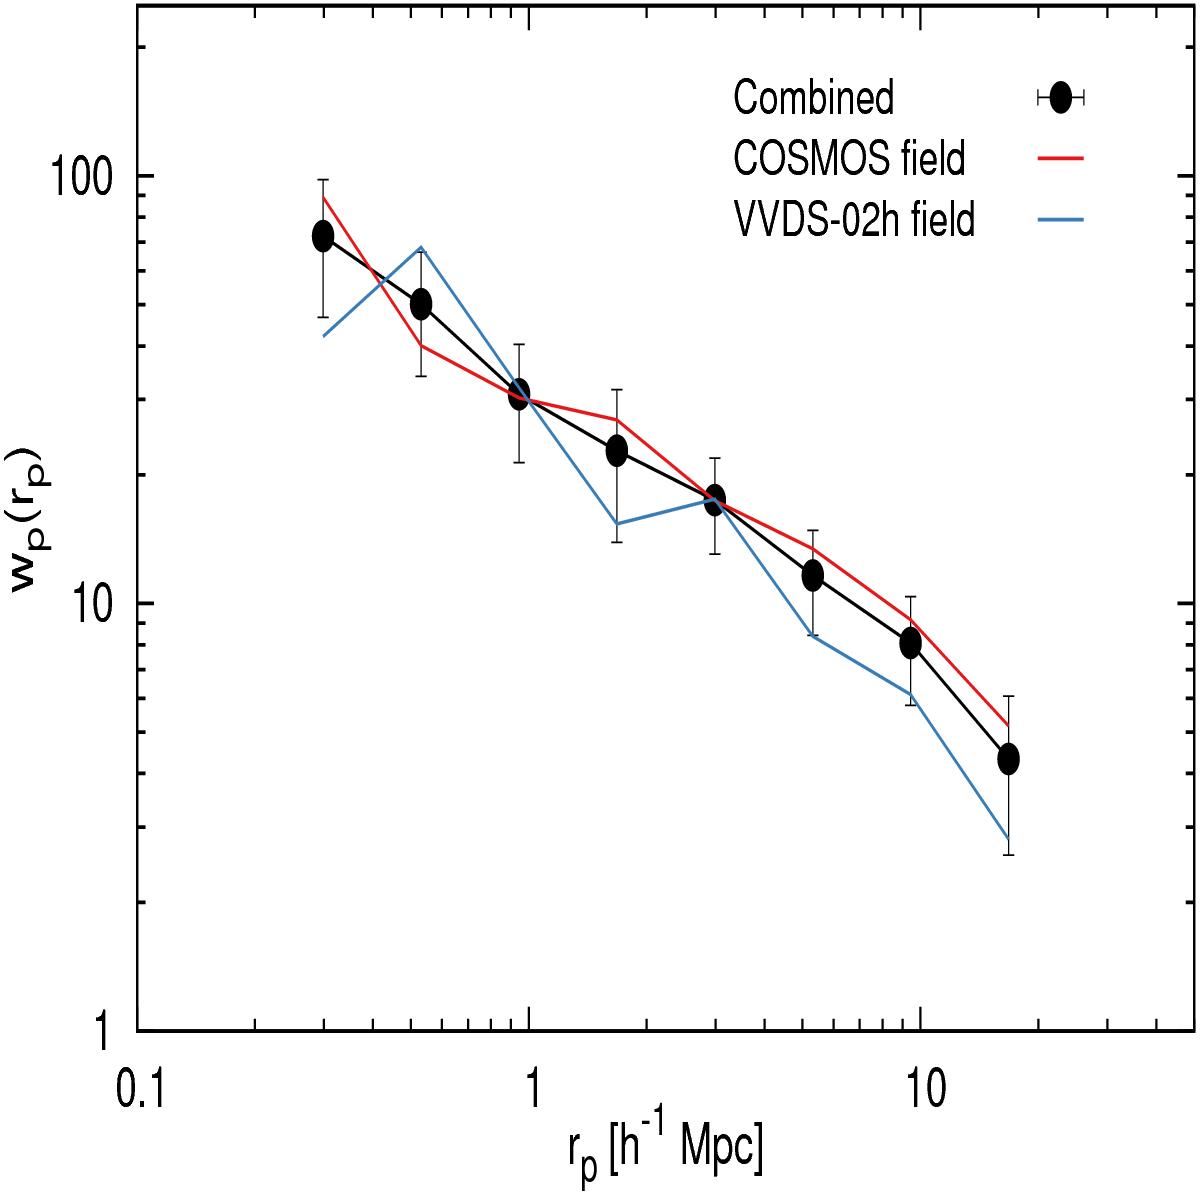
Projected two-point correlation function wp(rp) in each individual VUDS field for the redshift range 2 <z< 5. Blue and red lines correspond to the VVDS and COSMOS field, respectively. Black points and line indicate the combined correlation function from the measurements preformed on galaxies from both fields simultaneously.
Current usage metrics show cumulative count of Article Views (full-text article views including HTML views, PDF and ePub downloads, according to the available data) and Abstracts Views on Vision4Press platform.
Data correspond to usage on the plateform after 2015. The current usage metrics is available 48-96 hours after online publication and is updated daily on week days.
Initial download of the metrics may take a while.