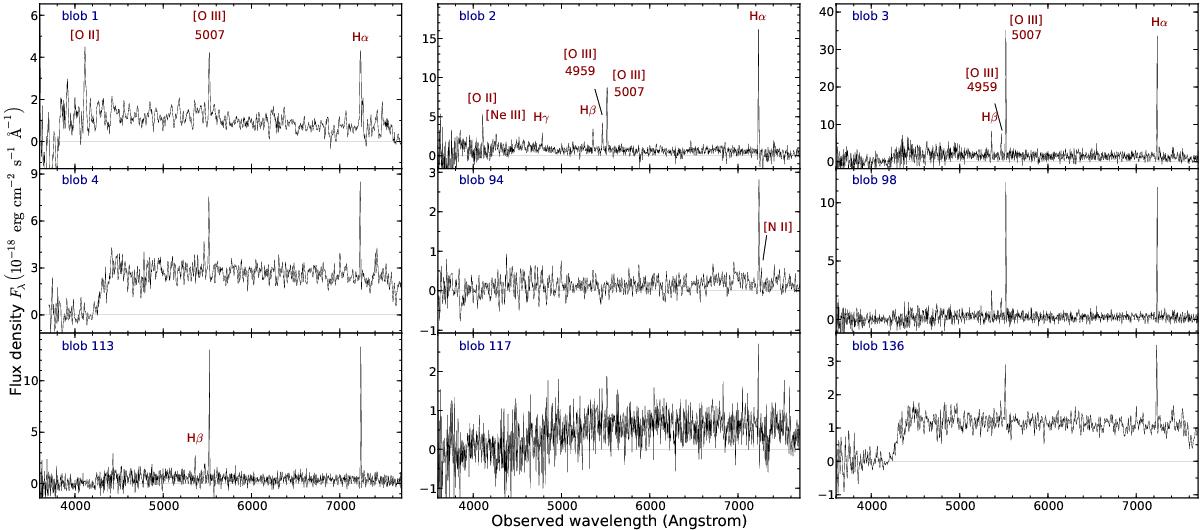
Fig. 4

Spectra of the nine blobs we found in our VLT/FORS2 2D spectra that show various emission lines, indicative of star formation at a common redshift of z = 0.102 (x axes are observed wavelengths). Blobs 94 and 98 have no optical counterpart on the Gemini i-band image but showed up in the trace of the FORS2 spectrum. In blobs 2 and 3 the Hα and the [O iii] (5007) line are very strong. In blob 3 we measure an equivalent width of 220 ± 20 Å and 170 ± 20 Å, respectively.
Current usage metrics show cumulative count of Article Views (full-text article views including HTML views, PDF and ePub downloads, according to the available data) and Abstracts Views on Vision4Press platform.
Data correspond to usage on the plateform after 2015. The current usage metrics is available 48-96 hours after online publication and is updated daily on week days.
Initial download of the metrics may take a while.


