Fig. 6
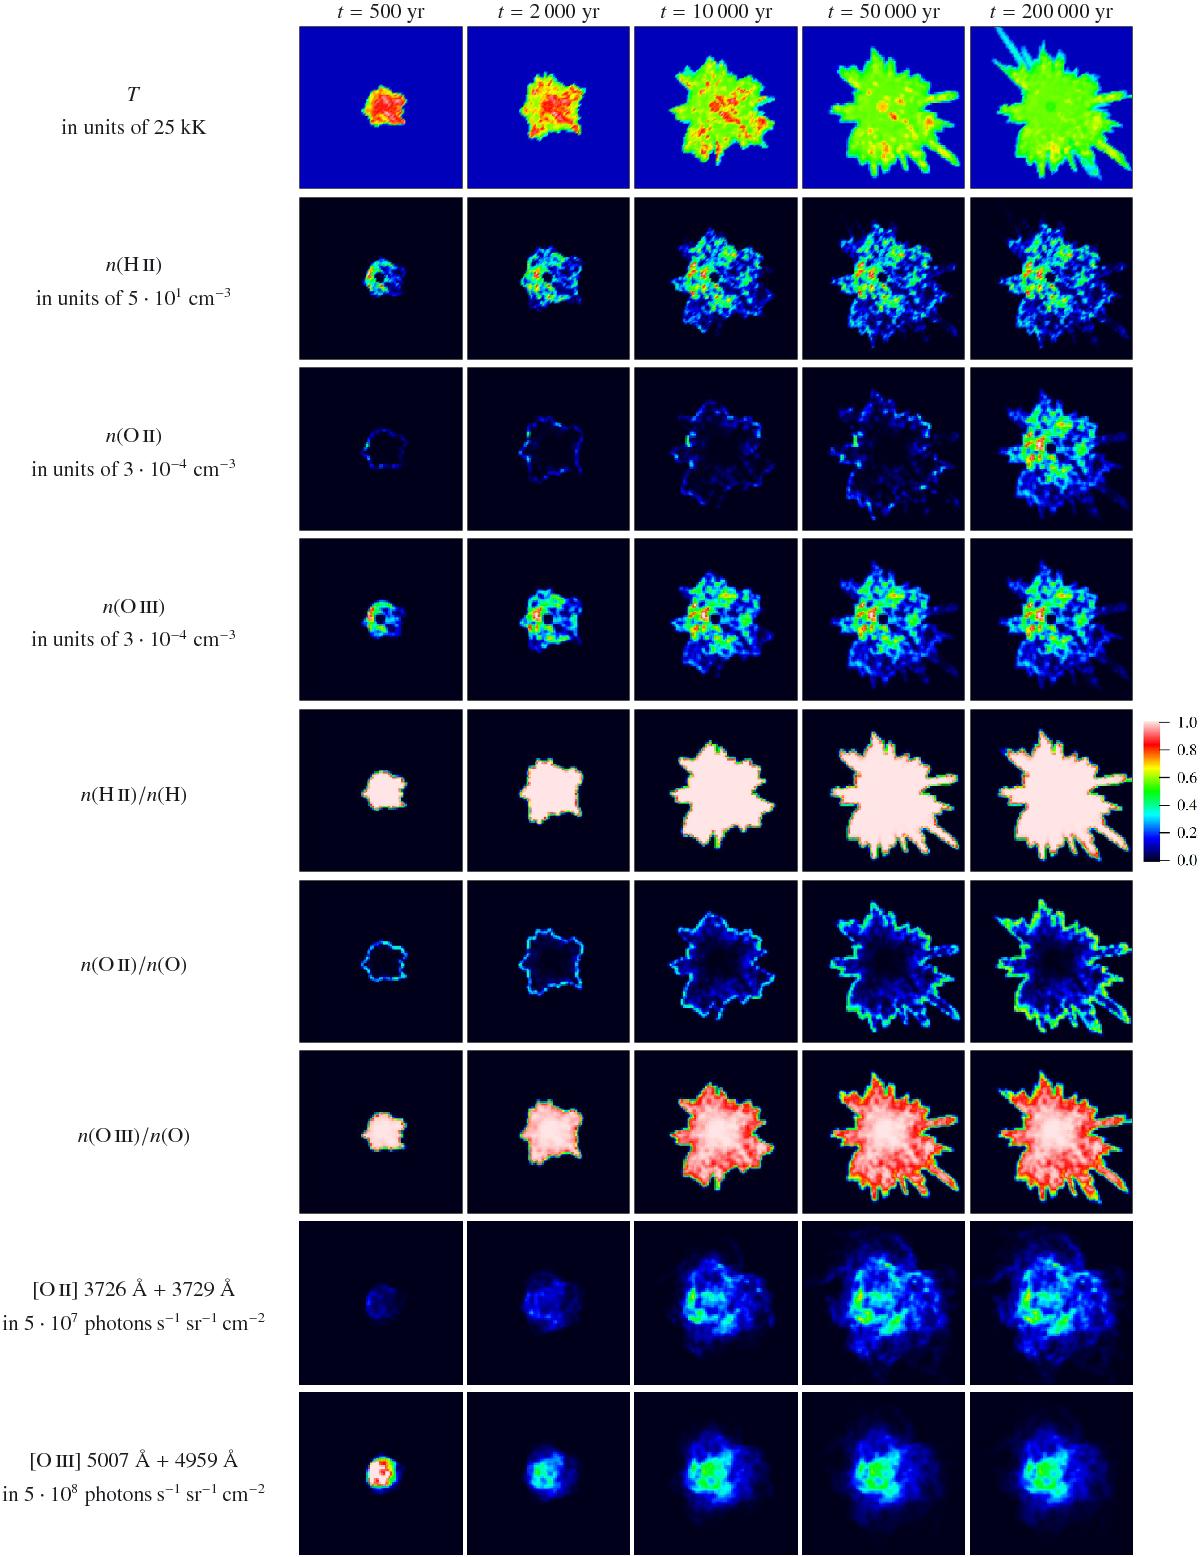
Temporal evolution of a H ii region expanding in a volume of (40 pc)3 filled with inhomogeneously distributed (initially neutral) gas. The top seven rows show cross sections through the center of the volume and show the temperature and the absolute as well as relative number densities of the ions H ii, O ii, and O iii. Lower two rows: synthetic images of the line intensities of [O ii] 3726 Å + 3729 Å and [O iii] 5007 Å + 4959 Å. In these models, both the central ionizing star (a 40 000 K dwarf) and the gas have a metallicity of 0.1 Z⊙.
Current usage metrics show cumulative count of Article Views (full-text article views including HTML views, PDF and ePub downloads, according to the available data) and Abstracts Views on Vision4Press platform.
Data correspond to usage on the plateform after 2015. The current usage metrics is available 48-96 hours after online publication and is updated daily on week days.
Initial download of the metrics may take a while.