Fig. 5
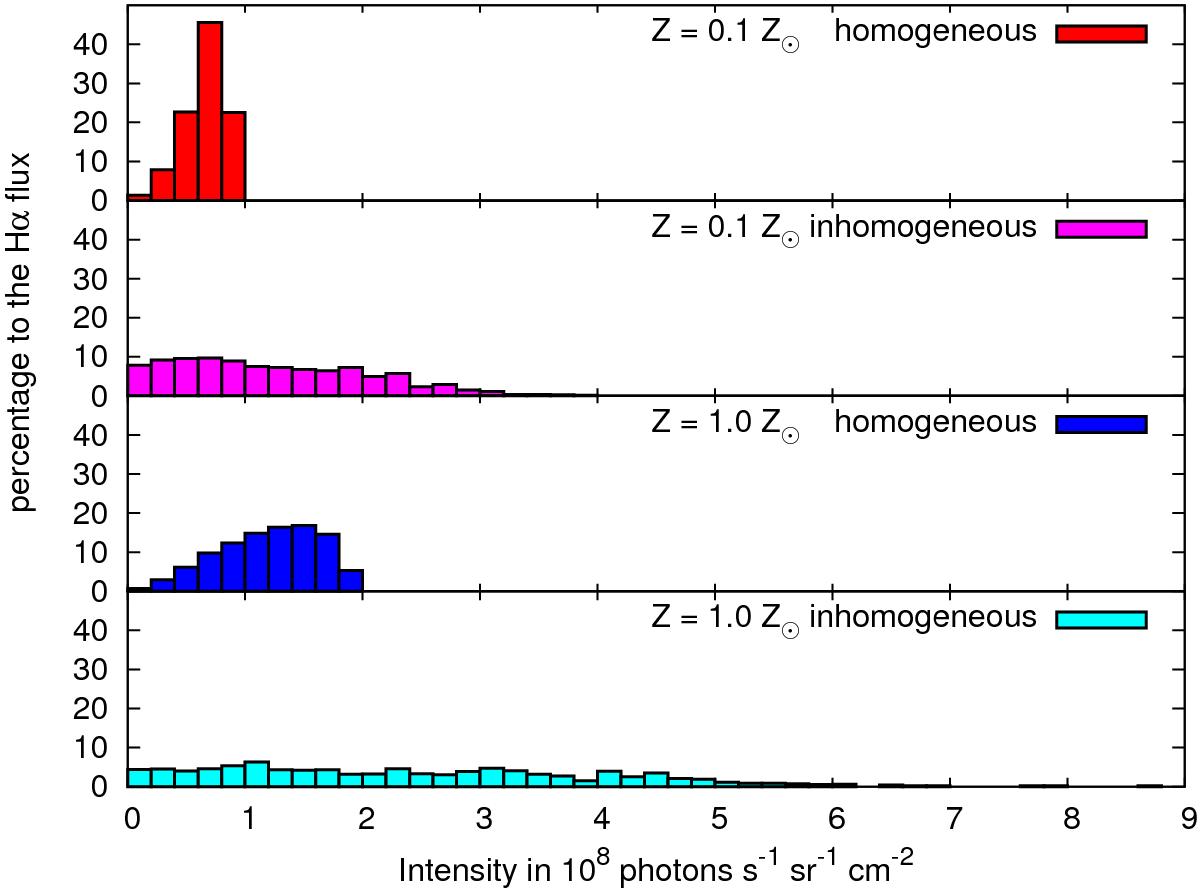
Synthetic images based on the fractally structured H ii regions shown in Fig. 4 reveal not only considerably different distributions of the emission line strengths, but also of the intensity patterns compared to those of the corresponding homogeneously structured H ii regions. The histograms illustrate this behavior for the Hα line by showing the contribution to the total Hα flux of all (projected) cells in a given intensity bin. While for the homogeneous gas (red/blue) the photon distribution is characterized by a pronounced peak near its maximum value, reached for the line of sight through the center of the H ii region, a broader distribution is obtained for the inhomogeneous models (magenta/cyan), where the maximum values are approximately a factor of 4 larger, resulting from lines of sight through dense clumps. The histograms also reveal that the highest photon-numbers of the 0.1 Z⊙ models are lower than those of the corresponding 1.0 Z⊙ models. This behavior is due to the lower temperature levels that are obtained for gases of higher metallicities and which result in higher recombination rates and thus in smaller ionized volumes (Sect. 3.1.2).
Current usage metrics show cumulative count of Article Views (full-text article views including HTML views, PDF and ePub downloads, according to the available data) and Abstracts Views on Vision4Press platform.
Data correspond to usage on the plateform after 2015. The current usage metrics is available 48-96 hours after online publication and is updated daily on week days.
Initial download of the metrics may take a while.