Fig. 4
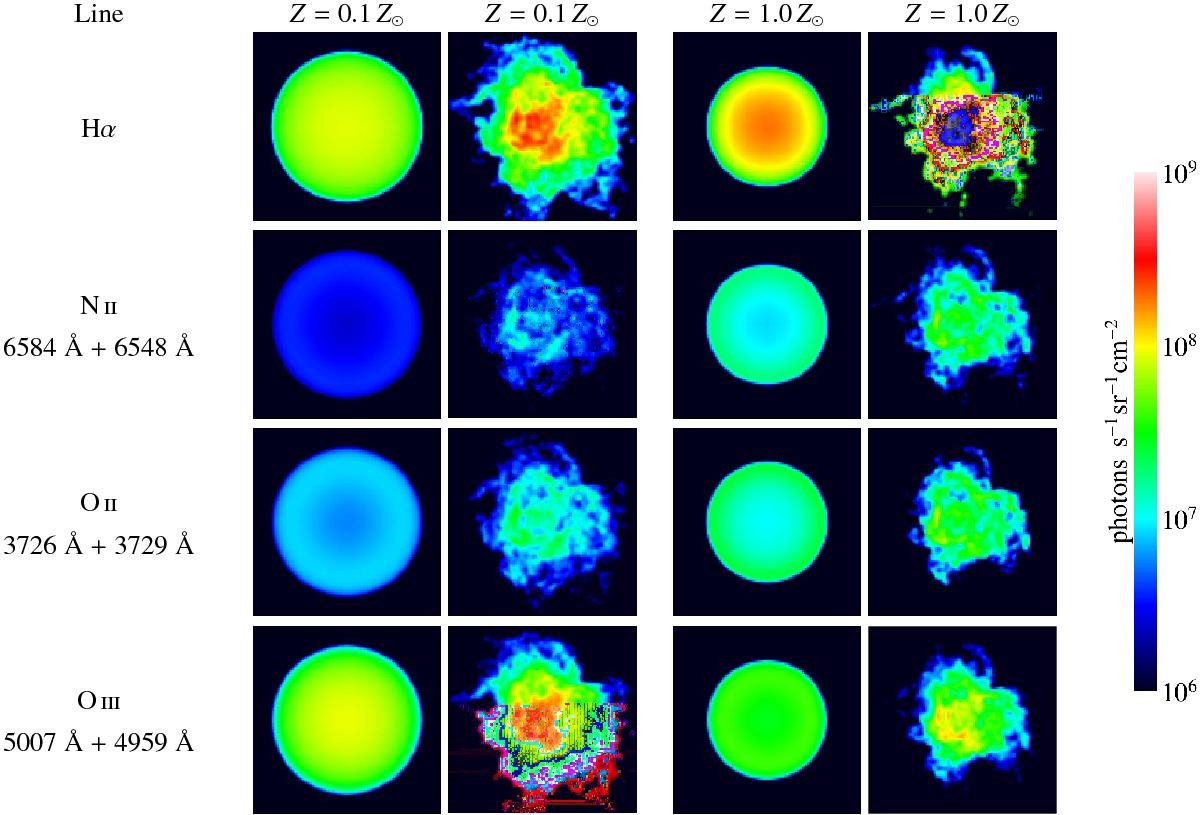
Synthetic images indicating the distribution of the emission line strengths of Hα, [N ii] 6584 Å + 6548 Å, [O ii] 3726 Å + 3729 Å, and [O iii] 5007 Å + 4959 Å for two different values of the metallicity (0.1 Z⊙ and 1.0 Z⊙). Compared are cases where the gas is spherically symmetric with a homogeneous density structure (nH = 10 cm-3) and cases where the gas is fractally structured with an inhomogeneous density structure of the same mean density. The source of ionization is located in the center of the simulated volume ([40 pc] 3) and is represented by the respective 40 000 K dwarf star (D-40) at the same metallicity as the gas (Sect. 2.2).
Current usage metrics show cumulative count of Article Views (full-text article views including HTML views, PDF and ePub downloads, according to the available data) and Abstracts Views on Vision4Press platform.
Data correspond to usage on the plateform after 2015. The current usage metrics is available 48-96 hours after online publication and is updated daily on week days.
Initial download of the metrics may take a while.